| Home | About Us | Resources | Archive | Free Reports | Market Window |
Get Rich On The Generation SwitchBy
Monday, December 12, 2005
My grandparents lived through the Great Depression. After living through that terrible decade, where stocks lost money, they never believed in buying stocks for the rest of their lives. My wife’s parents invested in stocks throughout the 1990s, when stocks soared. As a result, they’ll probably always believe that stocks can make you a fortune. My grandparents must have thought they were making a logical decision by avoiding stocks. If you’d lived through the Depression, and through a generation (seventeen years from 1930-1947) where stocks lost money, would you ever consider stocks? Yet my grandparents eventually missed out on some great gains... from 1947 to 1965 (18 years), the S&P 500 stock index went up over 500%. Folks who bought stocks in the 1950s, and made that 500% return, came to believe that stocks always go up. This stock boom ended with the “tronics” mania, the 1960's version of the dot-com stock mania. For the next generation from 1965 to 1981 (sixteen years), stocks lost money on an inflation-adjusted basis. Folks who invested heavily throughout the 1970s decided – like my grandparents did before – that you could never make money in stocks. It’s funny how it all goes in stages. Almost like clockwork, that ‘70s generation missed out on the greatest stock boom in history... Stocks soared from the end of 1981 to the end of 1999 (eighteen years). When you look at it over history, a rough pattern starts to emerge... A pattern where every 17 years or so, the investing generation switches. One investment rises by triple digits, the other loses money. Again, it’s not clockwork, but it is interesting. I can show this “switching” to you in a simple table. I’ve put together stock prices versus commodity prices. Take a look... triple-digits one generation, losses the next.
We’re into a new investment generation now... If the last investment generation ended around 1999, and if the pattern holds, then we could see stocks do poorly for about seventeen years... or until 2016. The statistics are flimsy, I’ll admit. But the generational idea makes sense... and the numbers do fall into place. Legendary investor Jeremy Grantham sees it too...
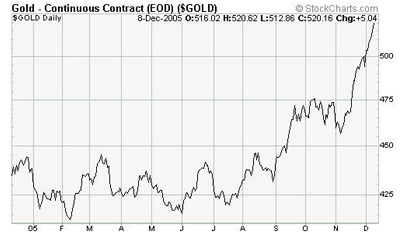
While the statistics might be flimsy, we’re on track once again. Since the end of 1999, the S&P 500 is down about 13%. Meanwhile, commodities prices (as measured by the CRB Index) are up 29%. Some commodities like oil and gold are up significantly more. The point today is not that you must invest in commodities now. The point today is that, sometimes, it’s good to be in stocks, and sometimes it’s not. How do you know when to be invested in stocks, and when to avoid ‘em? You can use this 17-year rule. Or, if it’s too flimsy, just think of it like this: If the last generation of investors loved stocks, and made triple-digit returns on them, then don’t buy ‘em. It’s too late. You missed it. Do something else. If the last generation of investors lost money in stocks for an entire generation, and now hate them, then it’s probably time to buy. The table above tells us... It’s time to do something else besides buy stocks. And just exactly what should you buy? That’s what we’re trying to deliver to you in our daily e-letters and monthly newsletters. We’ll keep you pointed in the right direction. Good investing, Steve Market NotesGOLD: A BULL MARKET IN ANY CURRENCYTo investors who own gold in U.S. dollar terms: You’re doing well, but not that well. Gold’s big move against the dollar (up 21% in 2005) has been impressive, but gold’s move against the other major currencies of the world has been much stronger. A one-year chart of gold in dollar terms:
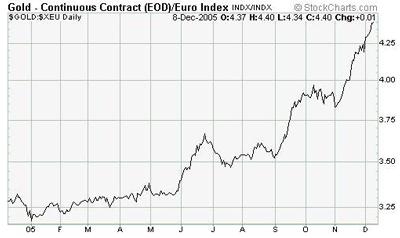
A one-year chart of gold against the Euro, up 37% in 2005:
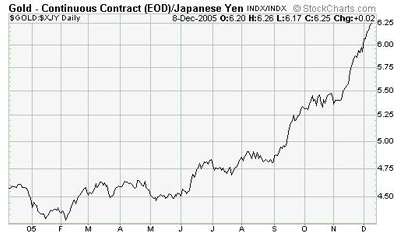
And finally, the weakest major currency versus gold, the Japanese Yen. As the one-year chart below shows, gold’s advance against the Yen has been incredible, up 41% in 2005.
As Dennis Gartman explained last week:
|
Recent Articles
|
||||||||||||||||||||||||||||||||||||||||||


