| Home | About Us | Resources | Archive | Free Reports | Market Window |
Buy This China BoomBy
Friday, October 1, 2010
"China is a bubble that will burst… "
Yeah, yeah, we hear that every day…
In the meantime, our paid subscribers are making a fortune buying China.
I told you about my China trade back in August. It is one of the simplest trades in the book. And it's going gangbusters, yet again.
I wrote: "Whenever the U.S. Federal Reserve has dramatically cut short-term interest rates lower than long-term interest rates, crazy things have happened in Hong Kong stocks... In three out of four cases, you'd have made three times your money or more (as much as eight times your money) in three years or less."
It's not quite a China trade… It's specifically a Hong Kong trade. It works (as I explained in August) because of a quirk in Hong Kong's currency system.
When I wrote that in August, Hong Kong wasn't fully off to the races… yet. But it is now. It's soaring.
The sky is the limit for Hong Kong stocks in this environment (when the Fed holds interest rates at ultra low levels).
If the Fed keeps rates this low, it is perfectly possible for Hong Kong stocks to soar to their highest valuations in their history – we're talking crazy, near-Nasdaq 2000-type levels.
What you want to do is get on board… And be ready to get out of the way when the music stops.
Whether it's a hike in rates by the Fed or some financial scare, be prepared… These stocks will fall hard, sometime.
But right now, we have the fundamental reason for a move in Hong Kong – zero percent rates from the Fed – and we have the uptrend. Ride it.
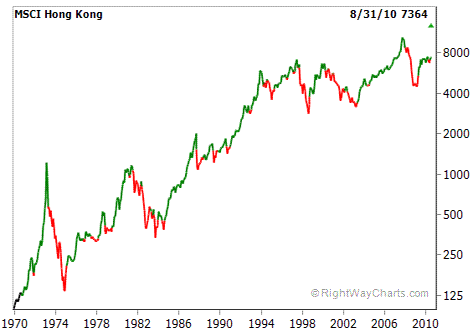
The simplest trend indicator is a moving average. When stocks are above the moving average, you want to own them. When they're below it, you want to be out. Here are the results of a simple trend strategy on the MSCI Hong Kong Index… Green, you're in. Red, you're out.
 Going back to 1970… When you're "in," your wealth compounds at nearly 21% a year. When you're "out," it only compounds at 5% a year (mostly dividends). The trend is simple. It's the 10-month moving average.
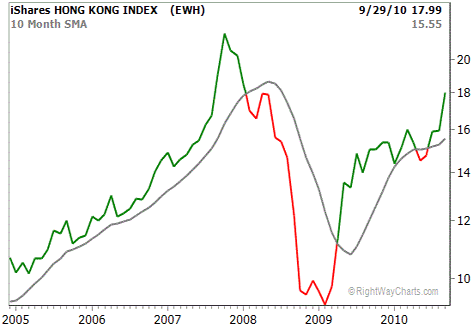
You can invest directly in this strategy through the iShares MSCI Hong Kong ETF (EWH). Here it is, shown over the last five years, with a 10-month moving average:
 This is a trend trade. Please don't get married to it. Approach it rationally… The way I recommend trading it, you could end up with a small loss… or a triple-digit gain.
The small loss would come from your exit strategy – either exit when it crosses below the 10-month moving average, or when it hits your trailing stop.
The triple-digit gain would come from Hong Kong going nuts – as it certainly can do – when the Fed cuts rates to ridiculously low levels.
With trend trades like this, it's okay to lose small on a few of them, with the prospect of a triple-digit gain if you get it right.
Here's how I see it: triple-digit upside potential… with the risk of a small loss. I like those odds.
China might be in a bubble. Hong Kong might be headed that way. But with the tailwind of low rates, Hong Kong's market, in particular, could go higher than anyone imagines. It's the kind of "risk a little to potentially make a lot" that builds investment fortunes.
Good investing,
Further Reading:
In addition to going "long Hong Kong," another great way to invest in the rising wealth of Asia is to buy precious metals like gold and silver. It sounds like an odd idea, so make sure to read this outstanding piece from our colleague Jeff Clark of Casey Research here: How and Why China Will Flood the Gold Market
Following simple "trend trades" like Steve's Hong Kong trade is an incredibly easy and safe way to make money in the market. Steve recently wrote how one such system manages to ring up extraordinary returns in the oil market. "Even better," he writes, "you could teach a monkey to follow it, and it would only take maybe 12 minutes a year." Learn more here: My Simple Oil System.
Market NotesGET READY FOR A SILVER SHAKEOUT Today's message for all of the fortunate silver owners out there: Congratulations on the gains… Now get ready for a speed bump.
After spending much of this year locked in a long sideways price base, gold's cheaper cousin silver staged a huge upside breakout in August. This breakout took the metal from $18 per ounce to $22 in just over a month – an extraordinary rise in such a short time. Now it's time for the metal to take a breather…
Below today's price chart, you'll find an indicator called the Relative Strength Index (RSI). The RSI measures overbought or oversold conditions on a given asset. When folks go wild for an asset, the RSI can reach "race car in the red" readings above 80. At this point, the asset is a stretched rubber band ready to snap back.
As you can see from the lower right hand side of the chart, silver's spike higher has left it more stretched to the upside than it has been in two years. Each time this overbought territory was reached (marked by red arrows), silver suffered a fast sell off.
Long term, silver's allure as a "real money" asset will take it higher and higher. But before the next big leg up can be made, the crowd must be shaken off. They should be whacked any day now…
|
In The Daily Crux
Recent Articles
|

