
Not a subscriber? Click here to learn
more.
|
| Home | About Us | Resources | Archive | Free Reports | Market Window |
A Set of Charts Every Retiree Should SeeBy
Thursday, May 17, 2012
It's one of the biggest concerns of our time...
"Is the U.S. government's crazed borrowing and spending going to lead to inflation? Is my nest egg at risk? How can I protect myself?"
I don't blame people for worrying. I've been in the financial markets for over 30 years, and I've never seen such extreme government overreactions to economic concerns. I'm sure it's going to cause problems years down the road.
But if you're worried about this... relax. Once you sift through the hype and take a look at the real numbers, you'll see no signs of runaway inflation. Today, I'll show you a few charts that prove it...
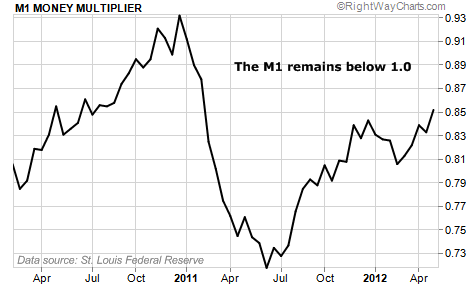
Regular readers know my favorite monitor of potential inflation is the Federal Reserve's "M1 money multiplier."
The M1 money multiplier is a measure of how quickly money is flowing around the economy. All you need to know about this statistic is if it's over 1.0, banks are taking their depositors' money and loaning it out – money is flowing. As long as it stays below 1.0, the money is not circulating.
The M1 has been increasing slowly over the past two years... but it remains below 1.0. So inflation should not be a big worry in 2012.
 Here's another dramatic chart that confirms this idea...
It's the price of natural gas over the last two years. The price of energy plays a large role in manufacturing costs, transportation of goods and services, energy production for homes and business, and so on. If prices go up, this is often passed right up the line and could slow the current economic growth. We call this "cost push" inflation.
But as you can see below, the energy front looks great right now.
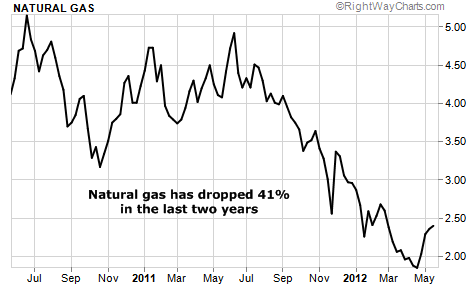 Lower natural gas prices mean lower input costs. Businesses that use natural gas will be able to cut prices to gain competitive edges. It also means competing fuels – like oil and gasoline – could see prices plummet in the U.S.
Let me show you one more chart before I sign off: wholesale inventories over the last two years. It measures whether goods are moving... or piling up in warehouses.
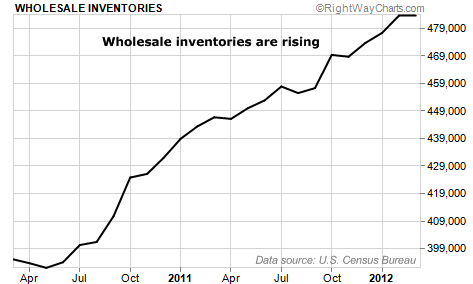 Inventories are now stacking up above pre-recession levels and climbing higher. This suggests little pressure further out along the "cost push" pipeline.
All three charts say inflation isn't a problem. And when I look at charts that measure how much of our manufacturing capacity we're using... employment numbers... the government-created "consumer price index"... and construction spending, they all tell me pretty much the same thing:
Over the past six months, the U.S. economy has kept up a slow, steady pace of growth. If things continue at this slow pace, we could enjoy a stable, "middle of the economic-cycle" recovery for years.
In short, we have little to worry about.
I'm still encouraging readers to own the world's best dividend-paying companies, which will provide excellent protection against inflation. And I think it's reasonable to have a small position in "chaos hedges" like gold and silver.
But I'm also telling every retiree who asks me about inflation not to panic. You should do the same.
Here's to our health, wealth, and a great retirement,
David Eifrig
Further Reading:
Doc has been monitoring the M1 indicator for a few years now... And back in 2010, he found a "one click" way to protect yourself from both inflation and deflation. Following his advice would have led to easy 20% gains. Learn more here: An Easy Solution to a Major Retirement Worry.
Besides the M1 money multiplier, Doc has a few other ways to monitor what's happening in the global economy. Get two of his other reliable indicators here.
Market NotesA BULL MARKET IN U.S. DOLLARS The U.S. dollar is winning the "least ugly" contest...
Like China, the U.S. dollar is the subject of a big financial debate. Bears say the U.S. is under a crushing debt load... which will push the value of the dollar lower and cause it to lose its "reserve currency" status. (The world's "reserve currency" is the one most people use to conduct business.) Bulls say the U.S. is doing just fine... so keep owning dollars.
One point in the bulls' favor is that the competition is ugly. The European Monetary Union is unraveling. Japan is in terminal, long-term decline. And China's financial system is many, many years away from being as robust as the U.S. system. We'll say, "Sure, the dollar has problems... but its competition has worse problems."
Today's chart shows how the U.S. dollar is winning the "least ugly" contest. People are fleeing the declining euro for the relative safety of dollars. This "flight" has caused the dollar to rally 9% since August 2011.
 |
In The Daily Crux
Recent Articles
|


