
Not a subscriber? Click here to learn
more.
|
| Home | About Us | Resources | Archive | Free Reports | Market Window |
A Scheme Even the Biggest Gold Miners Are RunningBy
Friday, November 9, 2012
Hardcore gold and gold-stock investors are a unique breed.
They are not like "normal" investors. Most hardcore gold investors see gold (and often silver) as the only real form of money. They expect it to soar when the world falls apart. They fall in love with gold... more so than an investor likes his shares of Google or Microsoft. So when gold and gold stocks fail to live up to bullish expectations, the level of disappointment is very high.
I see gold as "real money" as well. I'm a proud gold owner. But my job is to help readers make money, not to get emotionally attached to any one investment.
That's why we need to understand why over the last decade... an investment in gold bullion performed 30% better than the largest gold miners in the industry. If you don't understand what I'm about to tell you, you could be making a huge mistake...
Historically, companies that mine and produce gold do well as the price of gold rises.
However, since 2002, the gold price has risen 446%, while the benchmark index of gold-mining stocks – the NYSE Arca Gold BUGS Index (NYSEARCE: HUI) – is up just 344%. And gold bullion has outperformed mining companies by a ratio of 5-to-1 since January 2010.
According to Michael Kosowan, a former engineer with giant miner Placer Dome, the reason is simple... Most miners sacrificed profits for growth.
These companies had little competition for gold-investing dollars. Before 2005, the only way to invest in gold was to buy bullion or gold-mining stocks. And since investors rewarded companies that grew (by valuing businesses on the size of their reserves)...
Grow they did – poorly and with little discipline.
The companies' primary focus wasn't running profitable mines... but tapping as much of that investment capital as possible. Whether a mining project could ever turn a profit mattered less than simply jacking up reserve numbers. So the companies routinely overpaid for bad assets.
That devastated their shareholders' returns. Let me show you what that looked like with a well-known gold miner...
From 2005 to 2011, Agnico-Eagle added 8 million ounces of gold to its reserves – an impressive 80% surge from its 2005 reserve total of 10.4 million. It even grew production by 308%. That all looks great... especially when you factor in gold's run from $425 per ounce to more than $1,500 per ounce during that period.
That should be the ideal situation – growing gold production, while gold prices are soaring.
The following chart shows how well investing in growth worked out... It shows two key measures of Agnico-Eagle's business – profit margin and return on invested capital (ROIC).
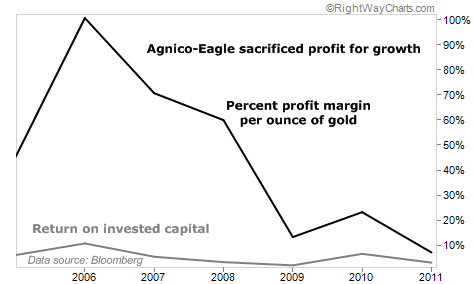 While the profit per ounce looked great in 2006-2007, the more insidious number here is the ROIC. This simple measure shows us how much profit a company makes from the money it plows into the business. And as you can see, Agnico-Eagle's ROIC is in the single digits, hitting a low of 3% in 2011. That's terrible...
Gold prices were sailing higher... But Agnico's acquisitions were low-margin businesses – properties that cost a lot of money to mine.
About half of Agnico's reserve growth during the period came from its "flagship" acquisition, the Meadowbank mine. In 2007, Agnico-Eagle acquired Cumberland Resources, which owned Meadowbank, for C$710 million. It was touted as a low-cost gold producer in the Nunavut region in far northeastern Canada.
When Agnico evaluated Meadowbank for acquisition, the company projected mining costs at $224 an ounce, well below the average price of gold at the time – $604 an ounce. In fact, today, mining costs run around $1,040 per ounce.
Part of the problem is location. Transportation is a component of production costs... and transporting gold from remote Nunavut is wildly expensive. Another problem is that Agnico thought the mine would help propel its production to more than 1.3 million ounces per year by 2010... That didn't quite happen. The company produced 990,000 ounces last year... well short of its stated goal.
In the fourth quarter of 2011, the company wrote off $604 million on the project... 85% of its initial acquisition price four years earlier.
That's $604 million of shareholder money gone forever. And it shows. Over the last five years, gold has more than doubled in price. Agnico shares are barely up 10%. You would have increased your returns 10-fold by simply stashing Maple Leafs under your mattress.
I picked on Agnico-Eagle today... but it's not the only big miner involved in this scheme. Gold-producing companies spent the last 10 years acquiring and merging with each other, pursuing growth at all costs. And we now have a handful of big mining companies saddled with lots of uneconomic assets.
In my next essay, I'll show you the worst of the bunch... and what gold-stock investors must be on the lookout for.
Good investing,
Matt Badiali
Further Reading:
This "growth over profits" mentality is a huge problem for gold-stock investors... And last month, Matt showed readers one way this scheme can steal the cash right out of your pocket. Learn why it's so important to do your homework on gold stocks here.
Market NotesCHINA BULLS: GET READY FOR AN UPSIDE BREAKOUT China bears take note…
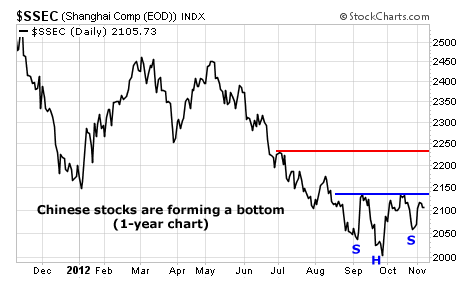
Today's chart shows the Shanghai Stock Exchange Index (SSEC). This index is like the "Dow Industrials of China." It tracks the price action in the country's most important equities. For much of the past three years, this index has slumped. But as you can see in the chart below, China is slowly turning bullish.
The SSEC shows the potential for an inverse head-and-shoulders pattern. This is a bottoming formation, which usually indicates the reversal of a trend from bearish to bullish. The pattern starts to form when a chart hits a new low, as the SSEC did in October. It then rallies and breaks the trend of lower highs. If the next decline fails to make a lower low before it starts to rally again, the potential for a trend reversal is in place.
If the SSEC can break above the neckline (the blue line) of the pattern – at about 2,130 – it should be a quick trip up to the next resistance line near 2,250 (the red line).
– Jeff Clark
 |
In The Daily Crux
Recent Articles
|


