
Not a subscriber? Click here to learn
more.
|
| Home | About Us | Resources | Archive | Free Reports | Market Window |
Why We're Closer to the "End of America" Than Ever BeforeBy
Thursday, March 14, 2013
Over the past several years, I've outlined an "End of America" scenario – a global loss of faith in the U.S. dollar caused by our federal government's runaway debts.
Some might point to the Dow Jones Industrial Average's new all-time highs and wonder if I got it wrong. But as I argued yesterday, when the dollar loses value, it causes the nominal price of stocks and the nominal amount of earnings to go up. In short, a weaker dollar is one path to a higher stock market. But it's not the path to prosperity or wealth.
It's just a sign of more dollars in the system.
For proof of this, let's look at some data points that describe our economy today versus nearly six years ago, when we were last at these levels on the Dow.
By the way, I've deliberately chosen to examine specific, real-world prices as often as possible, because I have no faith in the official government statistics.
What did energy cost six years ago?
This is the one area where America's economy has clearly seen a drastic improvement. The discovery of massive new energy supplies in America is the one thing that could realistically save us from our debt crisis. We're now producing more liquid fuel than Saudi Arabia. That hasn't been true since 1992. As a result, the cost of energy in our economy has fallen significantly.
Back in 2007, a gallon of propane cost $1.54. Today, it's only $0.84, a 45% decline. A barrel of oil cost $98 in 2007. Today, it's trading for $90. But gasoline has gone up. A gallon of gas (wholesale) in 2007 was $2.39. Today, it's $2.85.
Why has gas gone up? Mostly because of political restrictions on building new refineries... but also because most of the existing refineries are designed to process sour crude, not the light, sweet crude we're producing domestically. And since the crooks in Washington won't let companies export crude oil, these markets can't be put into better balance.
What did food cost six years ago?
Corn is the most important food crop in America. Back in 2007, government efforts to build a domestic ethanol industry (which led to dozens of bankruptcies) sent corn prices soaring to around $4 a bushel – a price most farmers couldn't believe. (That's what happens when you decide to burn 40% of the domestic crop in an insane effort to make gasoline out of food...) Today, corn sits at $7 a bushel, 75% more expensive than it was six years ago. And we're still stupidly using food as a fuel.
What were wages six years ago?
The federal minimum wage at the beginning of 2007 was $5.15 per hour. Today, it's up 40%, to $7.25 per hour.
How much was real estate?
Real estate – where the previous credit bubble was focused – has seen price declines. The average home in Miami Beach, for example, cost $370,000 in the fall of 2007. Today, that figure is $294,000.
On the other hand... rents – which were not directly connected to the big credit bubble – have gone up. A typical two-bedroom, two-bathroom apartment in downtown Atlanta, between Buckhead and Midtown, cost $1,075 per month in 2007. Today, it's $1,350 per month. That's a 25% increase.
How much were domestic-manufactured goods?
One of the best examples of the decline in the purchasing power of the dollar is domestic-manufactured items. The Ford F-150 is the bestselling vehicle in the United States. Ford is an iconic American company... and it didn't take a bailout in 2009, either. The base F-150 model retailed for $18,275 in 2007. Today, it retails for $23,670, a 30% increase.
I'd argue that the real-world data shows pretty clearly that the value of the dollar has fallen by a substantial amount. I'd estimate between 20% and 40% of its purchasing power has been erased.
But of course, there are other measures that matter, too.
For example, how has the dollar fared against other currencies? Actually, since 2007, it has strengthened against both the yen and the euro – as those currencies have seen even greater purchasing-power losses. What about gold? Gold has gone from $832 per ounce to around $1,500 per ounce. That represents an enormous decline in the dollar's purchasing power.
As the dollar has fallen, our debts have continued to grow – at a faster and faster pace. Total U.S. federal debt has gone from $9 trillion in the fall of 2007 to more than $16 trillion today. That's an increase from 65% of GDP to more than 103% of GDP.
The total debt in our economy has grown from $55 trillion to more than $58 trillion. Meanwhile, the government continues to take up more and more of the credit in our economy. Likewise, as a percentage of GDP, federal government spending has grown from 19% of GDP to more than 24%. States spend another 15% of GDP on top of this, pushing government in all forms to more than 40% of GDP.
Forget about the U.S. becoming the next France... we're already there.
Regards,
Porter Stansberry
Further Reading:
Yesterday, Porter admitted that his most important "End of America" prediction – soaring interest rates – "has been totally wrong." But the real test of his hypothesis is yet to come... See what "foolproof" strategy Porter still believes could lead to a global run on the dollar here: The One Thing I Got Wrong About the "End of America".
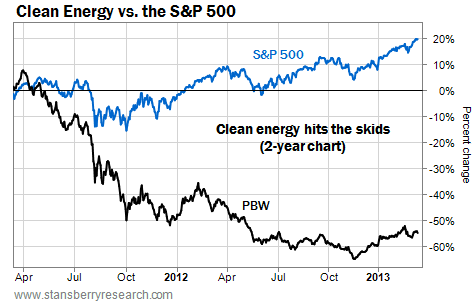
Market NotesA STUPENDOUS PERFORMANCE FROM CLEAN ENERGY Today's chart shows a stunning performance that even we can hardly believe...
The performance is from clean energy stocks... and it is terrible.
For many years now, we've been outspoken critics of clean energy stocks. Most of these firms are such terrible businesses that you could say they are "perfectly hedged." They lose money in both good economic times and bad economic times. Their share prices are able to sink in both bull markets and bear markets.
We monitor clean energy stocks with the PowerShares Clean Energy Fund (NYSE: PBW). This easy, "one click" way to go long solar, wind, and various other clean energy companies has drawn in hundreds of millions of investor dollars over the past few years.
The chart below shows how a lot of those dollars have gone to "money heaven." Our chart displays the past two years' performance of the PBW (the black line) versus the broad market (the blue line). While the broad market has advanced more than 20%, the PBW has fallen 52%. Even hardened critics like us are surprised at just how much PBW investors have lost.
– Brian Hunt
 |
In The Daily Crux
Recent Articles
|


