
Not a subscriber? Click here to learn
more.
|
| Home | About Us | Resources | Archive | Free Reports | Market Window |
The Myth About Buying at New HighsBy
Tuesday, May 13, 2014
I have a surprising message for you today...
It's something that will give you an edge over your fellow investors. It's something that will allow you to keep making money in stocks after they have sold.
Let me explain...
The U.S. stock market just hit a record high yesterday. That probably gets you worried.
You aren't alone... most investors get worried... because they believe that if we're at new highs, then there can't be much upside potential remaining in the markets.
Although that sounds right, it's actually completely wrong...
Think about this...
Sixty-three times since 2009, the stock market has closed the week at a new 52-week high. That's not 63 days – that's 63 weeks, 63 different Fridays – since 2009.
If you decided to sell your stocks because of any of those 63 new weekly highs, then you would be unhappy now... because you would have missed out on some phenomenal gains in stocks.
The thing is, what has happened since 2009 with new highs is not some kind of odd occurrence...
Buying at new highs has surprisingly been a winning strategy since the beginning of stock market history... Take a look at the average 12-month returns when buying at new highs versus new lows:
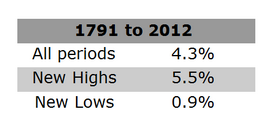 This table looks at monthly data instead of weekly, but the point is still the same... If you buy when the market is at a new 12-month high, then you outperform over the next 12 months.
Also, surprisingly, if you buy when the market is at a new 12-month low, then you underperform over the next 12 months.
Since we're not back in the 18th Century, let's look at things in more recent times...
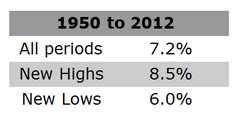 The point remains – you are better off buying the market when it's at a new 12-month high than a new 12-month low.
99% of investors don't know this. Just about all of them don't believe it. But it is completely true.
The numbers get even more shocking if the market has performed REALLY well lately...
For example, over the last 100 years, the Dow Jones stock index has gone up at about 5.4% a year (not including dividends). But when stocks soared in a short period of time, they continued to soar over the next year.
For example, if stocks rose by 10% or more in a quarter – then stocks performed outstandingly over the next 12 months – up roughly 10% over the next 12 months.
The opposite was true as well... If stocks fell dramatically in a quarter (by 7.5% or more), then stocks only managed to eek out a 3.5% gain over the next 12 months.
The moral to the story is – at the very least, don't worry about new highs... History tells us they are more of a good sign than a bad one. In short, new highs in the market are NOT a reason to sell.
Of course, one of these new highs is bound to be the top, eventually... I'm not blind to that idea. My point is, it's simply not smart to bail out just because stocks have hit new highs... History shows that, chances are, bigger gains lie ahead.
Good investing,
Steve
Further Reading:
There is one investment right now that Steve does recommend buying near its lows – gold. And he recently uncovered the perfect way to buy it. "Right now, we have an incredible window of opportunity," Steve writes. "There's a way you can buy gold at roughly $70 off melt value – a 6% discount." Click here to learn more.
And gold isn't the only commodity Steve thinks is a good buy today. He believes commodities in general are headed much higher, starting now. "The problem is finding the right way to buy them," Steve writes. "However, we've found an excellent way to make the trade." Click here for the full story.
Market NotesGET READY FOR A VOLATILITY SPIKE Get ready for the DailyWealth "law of volatility" to work its magic...
Regular readers are familiar with our "law of volatility." We've written about it many times. Here's the story...
There are few sure bets in the financial markets... and few definitive "this is the case, and it always will be" statements we're comfortable making. But one we'll stick by forever is, "Calm periods of rosy headlines and softly rising prices will always be interrupted by periods of wrenching volatility... and vice versa." That's just the way the world works. Statisticians call it "reversion to the mean."
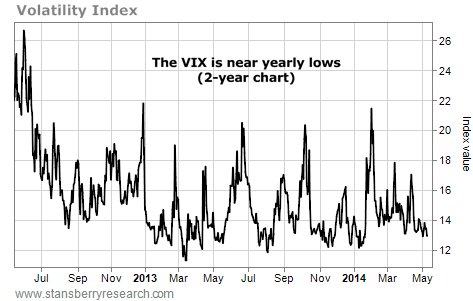
For a picture of this phenomenon, we present the past two years of the Volatility Index (the "VIX") – the most popular gauge of market volatility and investor fear. When the VIX is low (below 15), it indicates investors have few worries and see blue skies ahead. When the VIX is high (above 20), it indicates panic and confusion.
As you can see, the VIX has spiked several times in the past few years. But right now, it sits near its lowest reading of the past few years. This low volatility reading will not last. It's only a matter of time before some new crisis shoots the VIX higher.
 |

Recent Articles
|


