
Not a subscriber? Click here to learn
more.
|
| Home | About Us | Resources | Archive | Free Reports | Market Window |
Why Stocks Can STILL Soar Higher Than You Can ImagineBy
Friday, March 13, 2015
This U.S. bull market just celebrated its sixth birthday.
You might think – after six STRAIGHT years of gains – that stocks can't keep going up.
And you might think – with stocks trading at an expensive price-to-earnings (P/E) ratio – that stocks can't go much higher.
I disagree on both counts. Stocks can still go much higher from here.
Let me explain...
For starters, don't worry so much about where stocks have been. What's most important is where we are now, and where we're going.
You don't drive by only looking in the rear-view mirror, do you? You don't say "Gosh, we've been driving on Interstate 10 for 100 miles straight... It has to end soon, right?" No, it doesn't... Interstate 10 goes all the way from Florida to California.
Don't drive looking in the rear-view mirror. And don't worry that stocks have gone up six years straight. Instead, size them up on their merits now, and look ahead. Today, there are several reasons why stocks can head higher.
Namely, U.S. stocks actually aren't that expensive – particularly relative to interest rates (which I explained in this recent DailyWealth). But let's ignore interest rates for a moment. Let's just look at value by itself.
Stock market bears love to point to the 10-year average P/E ratio (known as the CAPE – or Cyclically Adjusted P/E ratio) as their favorite measure of value, to say that stocks are expensive and that the market has to crash.
These bears say the 10-year CAPE ratio is what Ben Graham, the father of value investing, said was the best measure of value in his legendary 1930s book Security Analysis.
The thing is, that's not altogether true...
Graham DID NOT say a 10-year average P/E ratio was best. Quoting the book, he said you want to use "the average earnings of a period between five and 10 years."
Importantly, to Graham, there was nothing magical about using the 10-year number. Graham's goal was simply to smooth out the business cycle, so your value number would be less volatile and more useful.
If we stick with Graham's method, but look at the five-year average P/E (as opposed to the 10-year average), we actually see that stocks are cheaper today than their average value over the past 20 years. Take a look:
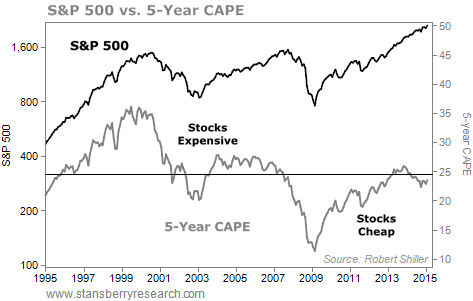 As you can see, stocks were extremely expensive before the crash in 2000. And stocks were extremely cheap in 2009. Today, stocks are somewhere in between. No, stocks aren't nearly as cheap today as they were a few years back. But they also aren't nearly as expensive – compared with recent history – as many stock market bears like to think.
We can't know the future. But from what I see, stocks still have plenty of room to head higher.
Good investing,
Steve
Further Reading:
Steve says there's another reason you want to own stocks today... They're yielding more than bonds. "Each time it has happened," he writes, "stocks have soared by at least 30% in the next 12 months." And it's starting to happen right now... Get all the details here.
If worries about the world economy are holding you back, Dr. David Eifrig says not to let misplaced fear keep you from taking advantage of great investment opportunities... "Right now is likely the best, safest time in the history of the world," he writes. Read his argument here: Are You Guilty of Thinking This Way?
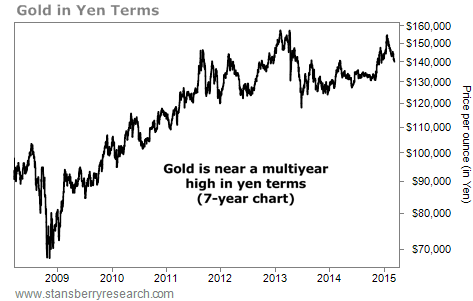
Market NotesWHAT'S GOLD DOING? IT DEPENDS... The price of gold is either near a multiyear high or a multiyear low. It all depends on where you sit.
Regular DailyWealth readers are familiar with our statement "there are always two sides to a price." On one side, you have the product, service, or asset being measured. On the other side, you have your "measuring unit," like dollars, Swiss francs, or Japanese yen. Keeping "two sides to a price" in mind lets you see things others do not. And once you understand this idea, you're liable to answer questions like, "did gold rise today?" with, "rise relative to what?"
We bring this up today because gold priced in U.S. dollars is nearing a multiyear low of around $1,150 per ounce. But as today's chart shows, gold priced in terms of Japanese yen is near a multiyear high.
U.S.-based readers hear a lot about problems facing the U.S. economy (the two biggest being debt and debt). But the debt problems facing Japan, the world's third largest economy, are much worse. To fight these problems, the government is printing money like crazy in an effort to stoke the economy... so its currency is plummeting in value. This leaves gold priced in yen near an all-time high... and likely to head higher.
 |

Recent Articles
|


