
Not a subscriber? Click here to learn
more.
|
| Home | About Us | Resources | Archive | Free Reports | Market Window |
Stocks Up 12 Days in a Row... What Happens Next?By
Thursday, June 11, 2015
The last 19 trading days in Japan have been CRAZY...
First, the Japanese stock market was up 12 days in a row. (I'm talking about Japan's Nikkei 225 stock market index.)
It was the longest stretch of consecutive days of gains in 27 years in Japan.
After a 12-day run, Japanese stocks were due for a breather, right? Well, they got more than a breather... the Nikkei fell six out of the next seven days.
That's the short-term picture of what has happened lately in Japan... But what happens when you look a bit further out?
Is a multiday run of gains a sign of a top? Or is it a sign of a strong market that is about to get stronger?
My True Wealth Systems research team recently gave me the answer. And it will surprise you...
Most people think many consecutive days of gains are a sign of a top... But according to our True Wealth Systems computers, the prevailing wisdom is wrong. Based on history, Japanese stocks are about to outperform.
Let me explain...
Having a few consecutive "up" days is typical in a bull market. Three or four positive days in a row is no big deal. It happens often. But having many consecutive "up" days – like eight or more – is nearly unheard of.
Our True Wealth Systems computers tell us that eight or more consecutive "up" days is a good thing... particularly for Japanese stocks. Here are the details...
Looking back over 35 years of data, Japan's Nikkei index has only seen eight or more consecutive "up" days 7% of the time. But as the table above shows, Japanese stocks more than doubled their normal returns over the next three months, six months, and one year. And after being up eight or more consecutive days, the rate for positive gains over the next year is 70%. That beats the 58% one-year winning percentage during all periods.
Yes, Japan's bull market is well under way. But history shows that this recent extreme points to more gains from here.
Subscribers to my True Wealth newsletter have made a LOT of money in Japanese stocks already... But history tells us we should have more gains to come...
Take advantage of it!
Good investing,
Steve
Further Reading:
U.S. stocks are also up big. They've soared more than 200% over the past few years. But despite years of steady gains, "investor bullishness" recently hit an extreme low. Based on history, that's a good sign for stocks over the next few months. Get all the details here.
Steve recently shared another reason why stocks can continue higher... because they're still a good relative value. Most people "see that stocks are expensive based on history," he writes. "But they are ignoring the fact that interest rates are near zero." Learn more here.
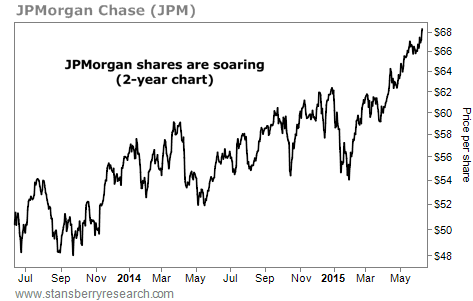
Market NotesBIG BANK STOCKS ARE SOARING, TOO Yesterday, we showed you the uptrend in regional banks... Today's chart shows America's big banks are doing well, too.
Regular DailyWealth readers know we monitor America's big banks, like JPMorgan Chase (JPM), Bank of America (BAC), and Citigroup (C). These firms are the "financial backbone" of America. They rise and fall with America's ability to make money, save money, service debts, and generally "just get along."
Like most stocks, the big banks suffered a crash in 2008/2009. Since then, they have worked their way into a bull market you almost never hear about.
The chart below shows this uptrend at work. It displays the price action in JPMorgan Chase over the past two years. You can see that JPM is enjoying a series of "higher highs and higher lows." Shares are up nearly 35% in two years... and just set a new all-time high yesterday. It's a bull market in American banking.
 |

Recent Articles
|


