
Not a subscriber? Click here to learn
more.
|
| Home | About Us | Resources | Archive | Free Reports | Market Window |
Welcome to the Next Chapter of the 'Melt Up'By
Wednesday, June 28, 2017
It was nearly two years ago... September 2015.
Stocks had just finished their first 10%-plus correction in years. But I was bullish.
I was preparing to give a speech at the Stansberry Alliance conference. It was titled "Welcome to the Melt Up."
I was worried as I got up on stage. I didn't know how the crowd would react.
I was about to give a speech that was against what everyone in the room believed.
They were all bearish – the speakers, the attendees, you name it. The stock market had fallen in August, and then again in September. These stock market declines had driven investors to an extreme in fear.
"Welcome to the Melt Up" was the opposite of what they wanted to hear. But it turned out to be exactly right...
Stocks have soared over the last two years... They've hit new high after new high.
Hindsight makes those gains seem obvious now. But calling for the "Melt Up" was a massively contrarian opinion in late 2015.
I was confident because I'd seen a Melt Up before...
The most recent major example was the top of the 1990s bull market. The Nasdaq Composite Index soared more than 86% in 1999 alone. Now that was a clear Melt-Up period.
Importantly, these huge Melt-Up gains typically begin after a time of extreme fear.
In late 1998, stocks had fallen dramatically in the wake of the Asian Financial Crisis, and we hit a fear extreme. Then, stocks surprised everyone and soared higher – the Nasdaq rose 200% in 18 months.
Take a look...
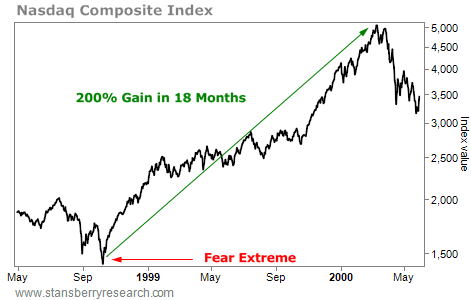 That's what a Melt Up looks like... a massive, blow-off top at the end of a bull market. The important thing to remember is that Melt Ups usually begin after a period of extreme fear. And that's exactly what we had in late 2015 and early 2016...
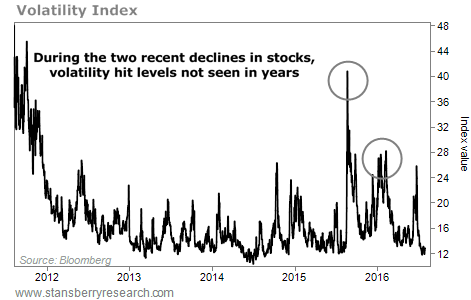
Stocks fell in autumn 2015 and at the beginning of 2016. In both cases, the short-term downside was 10%-plus. And those were the first 10%-plus declines in stocks since 2011.
Investors had gotten used to consistent gains and easy money. But these declines showed a crack in the armor, and that caused a major spike in fear.
One simple way to size up fear in the markets is through the Volatility Index (the "VIX") – often referred to as the market's "fear gauge."
The VIX spiked during both of these falls. Generally, a VIX reading above 20 shows fear in the market. And in autumn 2015, the VIX rose above 40 – a level not seen since 2011. The VIX nearly hit 30 again in early 2016. Take a look...
 This set the stage for what has happened since. It set the stage for the Melt Up... We were late in the bull market... And stocks fell slightly, causing a major fear extreme.
The S&P 500 is up around 37% since its 2016 bottom. That's the Melt Up in action. But I don't believe it's over yet.
Tomorrow, I'll show you why... and which parts of the U.S. market could soar the most as the Melt Up concludes.
Good investing,
Steve
Further Reading:
"For the first time in years, greed is driving investors," Steve says. Since the 2008 bust, investors have been fearful of getting back into stocks. But now, the switch has flipped. Read more here: The 'Melt Up' Is Here – Investor Optimism Hits a 17-Year High.
"What was my big mistake in the late 1990s?... I missed out on the fantastic performance of stocks during the final innings of the stock market boom," Steve writes. Learn how to apply the lessons of the last great Melt Up, right here: Dow 20,000 – Don't Chicken Out!
Market NotesANOTHER SIGN OF STRENGTH FOR THE U.S. ECONOMY Today, we'll highlight another U.S. economic "gauge"...
Recently, we've shown how strength in shipping companies, ski resorts, and swimming pools are all healthy signs for the economy. As long as these real-world indicators are enjoying booming profits and rising share prices, it shows American consumers are spending – and the economy can't be in the dumps.
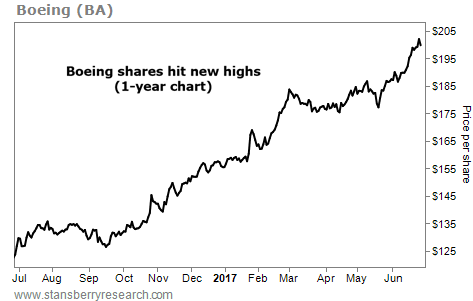
For proof, we'll look to shares of the world's largest manufacturer of commercial jets, Boeing (BA). When we last looked at the company in December, Boeing had announced an increased dividend and a huge share-buyback program. Shares had also broken out to a new all-time high. It was a good sign that people were traveling... and that the U.S. economy was doing well.
As you can see in the chart below, Boeing's strong performance has continued... Last week, the company collected 571 new plane orders at the Paris Air Show (beating its main competitor, Airbus, by more than 200 orders). Shares are up more than 60% in the past year... and recently hit another new high. It's one more sign that the U.S. economy is doing well...
 |

Recent Articles
|


