
Not a subscriber? Click here to learn
more.
|
| Home | About Us | Resources | Archive | Free Reports | Market Window |
Why the S&P 500 Could Surge Higher This YearBy
Friday, February 3, 2017
A new chart unexpectedly grabbed my attention recently... one that could have huge implications for the future of the U.S. stock market.
For the past month, I've been predicting a correction in the S&P 500 is right around the corner. But there's another side to the story...
If this correction happens the way I expect, it may trigger a key pattern in the stock market. This kind of setup doesn't happen often. But when it does, stocks have tended to see powerful rallies going forward... and this year, it could happen again.
Let's get right to it...
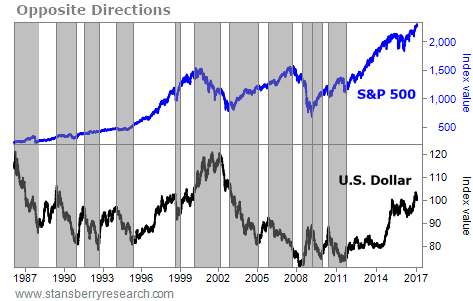
For the most part, the U.S. dollar and the S&P 500 move in opposite directions.
Stocks trading on the S&P 500 are priced in U.S. dollars, just like gold and oil. When the dollar is increasing in value, it takes fewer U.S. dollars to buy these assets... so their prices tend to fall.
Below is a comparison chart of the S&P 500 and the U.S. Dollar Index for the past 30 years. The gray highlighted areas show the times when the dollar and the S&P 500 were moving in opposite directions from one another.
 There are also times when the S&P 500 and the U.S. dollar both move up together. These are usually times of economic recovery... when everything is going right for the United States. When all cylinders are firing in the U.S. economy, it has no peers. At such times, the world wants our dollars and our assets. The chart below highlights these times over the past 30 years... 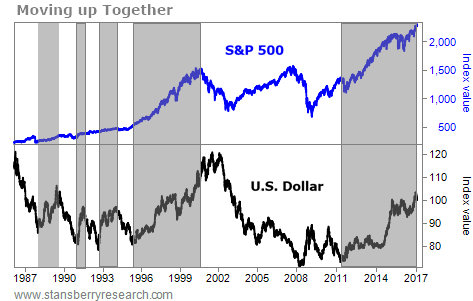 As these first two charts show, both situations are fairly common. We have frequently seen stocks moving opposite the dollar. And it's just as typical to see both of them moving up together. What's extremely uncommon, however, is to see both the S&P 500 and the U.S. dollar moving down together. That has only happened a handful of times over the last 30 years... as shown in the gray highlighted areas of the chart below.
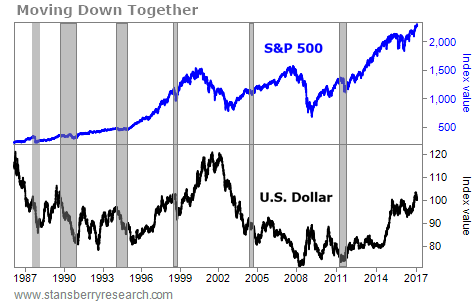 These are usually periods of sharp uncertainty in the U.S. economy. In 2011, for example, we experienced a year of slow growth and fears of a double-dip recession. In 2005, economic growth weakened unexpectedly, and consumer spending abruptly slowed. But what's striking about the periods when the S&P and the dollar moved down together is that those downtrends haven't lasted long... and the stock market moved significantly higher shortly thereafter.
As I said earlier, the U.S. economy usually doesn't disappoint for long. Periods of heightened economic uncertainty often resolve in upside surprises for the stock market as everyone figures out that the sky isn't really falling.
Why does all this matter today? Because I've been telling you for the past month that I expect both the U.S. dollar and the S&P 500 to start downward corrections in the near future. And that means we could be in for a surprising rally later this year...
One of the biggest signs is our "smart money" sentiment indicator – the commitments of commercial traders.
We can see what commercial hedgers are expecting in the market by looking at the Commitment of Traders ("COT") reports. And right now, the COT report is signaling headwinds ahead. The smart-money market players have been hedging their bets on the current rally most of this year, and they continue to do so today.
The COT report also shows that commercial traders are holding large bearish positions on the dollar, while open interest is increasing. The same pattern occurred in 2014, and again in early 2015... And each time, significant falls in the dollar followed.
Commercial hedgers can be wrong for months at a time (they have a lot more staying power than the rest of us). But eventually, they tend to be proven right.
If we do see both the dollar and the S&P 500 correct over the next few months, I'll be eagerly awaiting the start of a new rally in the S&P 500. It could be a very powerful one.
Regards,
Richard Smith
Further Reading:
In a "flash crash," stocks can drop as much in a day as they'd move in a year... and then rebound just as quickly. But you can avoid getting kicked out of your winning trades. Find out how in Richard's classic essay: Two Strategies to Avoid a 'Flash Crash' and Sleep Well at Night.
"Taking risks gives investors opportunities to succeed," Richard writes. "So how much risk is the right amount?" When you know your specific investing goals, you'll be able to make the right decisions and confidently build your wealth. Learn more here: How Much Risk Are YOU Willing to Take?
Market NotesA SAFE STRATEGY FOR ANY MARKET Today's chart shows one of our favorite investment concepts at work: owning capital-efficient businesses.
Regular readers know that capital-efficient businesses are able to greatly increase their earnings without spending much additional capital. Thanks to strong customer loyalty, they can gradually raise prices when they need to... And they consistently return loads of money to shareholders.
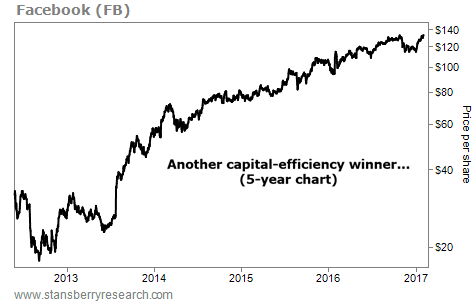
Today, we're highlighting a capital-efficient market leader that has skyrocketed in recent years. Facebook (FB) is the world's largest social-networking website. Today, more than 1.8 billion people use it to keep in touch with friends and family. That means Facebook reaps the profits as more than 20% of the world's population views its ads on their cellphones, tablets, and personal computers.
As you can see below, Facebook shares have surged over the past five years. They're up nearly 250% since the company's IPO... And they just touched a new all-time high. It's more proof that investing in capital-efficient businesses is one of the safest ways to make money in the stock market...
 |
Recent Articles
|


