| Home | About Us | Resources | Archive | Free Reports | Market Window |
The Price of This Commodity MUST Rise. It's Inevitable.By
Thursday, February 25, 2010
In the most recent issue of my Special Situations advisory, I showed my readers the most compelling resource investment around. I've spent the past month digging into this story and looking for the best opportunities. Here's what I've found.
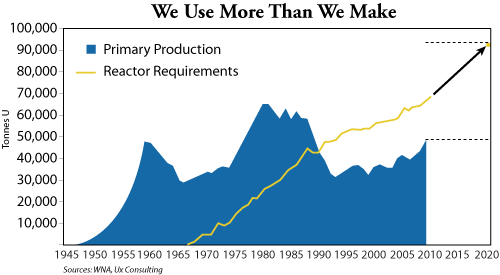
The most compelling thing about uranium is probably best expressed in the chart below...  The uranium market has been in deficit for several years, living off the stockpiles of the Cold War. Put simply, we use more than we make. Looking out to 2018, we're about 400 million pounds short. To get some perspective on that number, here is a look at the top 10 producers of uranium in 2009 and the percentage each makes up of the total market.
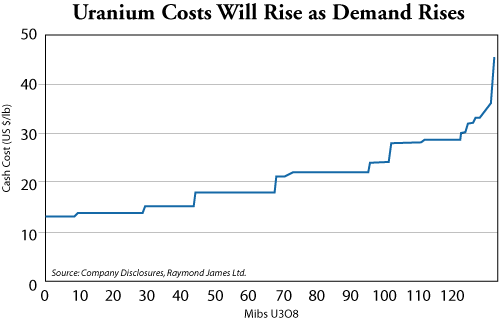
The top producers, which make up nearly 90% of the market, produced about 110 million pounds of uranium last year. So essentially, the industry needs to produce almost four times that to meet the estimated new demand through 2018. On an annual basis, the industry will need to about double in size. A sidelight to this is the fact that 63% of all uranium comes from just 10 mines. This means that the global supply of uranium is susceptible to supply shocks. If one big mine floods or goes down for whatever reason, it'll make a big wave in the uranium market. It gets even more interesting... Most of the best mines are already in production. As with everything else in the resource world these days, the low-hanging fruit is all gone. Future grades will be lower, meaning we'll have to mine a lot more ore to get a given amount of uranium. New mines are in more geologically challenging places. New supply is also coming from riskier places, such as Africa and Kazakhstan. All of this means that costs will go up. These facts are reflected in the industry's cost curve, as you can see in the chart below.  This tells you that at current production – about 130 million pounds – those last million pounds are a lot more expensive to produce than the first million pounds. It also means that as the industry ramps up beyond 130 million pounds to meet demand, costs will rise sharply. This is not a perfect predictor, of course. There are new mines that will come online and produce uranium at low costs. But it bodes well for a higher uranium price in the future. The current spot price is around $45 a pound. Only around 10%–30% of the uranium traded in any year is sold on the spot market. Most uranium is sold to utilities via long-term contracts. The longer-term price of uranium is north of $60. For some perspective on uranium pricing, consider that when uranium got hot in the summer of 2007, the spot price hit $136 a pound. It's done nothing but go down since then. If you are a contrarian thinker, which is to say a good investor, that fact will attract you. I can tell you with great certainty that the uranium price won't go to zero. That downward trend will reverse, and based on all the data I presented above, it looks like a higher uranium price over the next few years is a sure thing – or about as close to a sure thing as you can get in markets. That's why the uranium price has to go up. If it doesn't, there is no incentive for producers to make more, and hence a lot of reactors are going to go without fuel. More importantly, it can go up. Simply put, the uranium price could double and it wouldn't affect the economics of a nuclear reactor much. This is not true with a lot of commodities. If the price of oil doubled, the global economy would double over in great pain and probably grind to a halt. Not so with uranium. The biggest potential negative I see is the risk of some nuclear accident that derails this whole thesis as people abandon nuclear. But the industry has a clean safety record going back more than two decades now. There are 436 reactors in the world that provide about 15% of the world's electricity. The new reactors have fewer moving parts and are much better than the old ones. And most of the world seems to be coming around to the green benefits of nuclear power; even President Obama's administration promises loan guarantees and other goodies for the builders of nuclear reactors. In our carbon-worried world, nuclear is a relatively clean source of energy. For all these reasons, we see a massive buildup in reactors under construction, planned or proposed. The World Nuclear Association (WNA) says there are 52 reactors under construction, 135 reactors planned and 295 reactors proposed. This is what underpins that demand we talked about up top. Where are all those reactors going to be? Mostly, from China, India, Japan, and the U.S. Once again, we have a resource story driven by China and India. Neither country produces much uranium. China produces less than 2% of the world's uranium. If you believe "buy what China needs," as I do, then uranium fits well with that worldview. In conclusion, I want to own uranium. Good investing, Chris Editor's note: Chris Mayer is the editor of Capital & Crisis, a monthly advisory we consider required reading at DailyWealth. With Chris' research, you can always count on contrarian investment ideas you won't read about anywhere else. Click here to learn more about Capital & Crisis. Market NotesHOW TO JUDGE THE "HALF FULL VS. HALF EMPTY" DEBATE
The great guru debate right now: Is the economy in a real recovery, and is a decent job market on the way back? Or are high-profile bears like Harvard's Ken Rogoff right? Are new debt "shockwaves" set to rock everything?
As always, let's consult the market... and let's mind a huge potential "1-2-3 trend change." Bulls need the uptrends in companies like Darden Restaurants and Home Depot to remain intact. These uptrends tell us the government's E-Z-Credit program is keeping the consumer and the banking industry afloat. If the uptrends suffer severe breakdowns, we'll know the negative effects of the credit bubble are still with us. And don't forget to watch copper as a "must hold" asset for the inflationary bullish case. Copper is an essential ingredient in cars, refrigerators, power lines, and electronics. However the economy is performing – good, bad, ugly – you'll see it reflected in copper prices. As you can see from the chart below, copper suffered a major decline in late January/early February (1). It has since made an effort to climb back to its old high, which failed (2). We now have a situation where copper is set up for a classic Vic Sperandeo 1-2-3 trend change, just like the euro experienced in December. If copper turns lower – and blows through its recent low around $2.85 per pound (3) – the E-Z-Credit stimulus boom is withering. |
In The Daily Crux
Recent Articles
|
|||||||||||||||||||||||||||||||||||||||||

