
Not a subscriber? Click here to learn
more.
|
| Home | About Us | Resources | Archive | Free Reports | Market Window |
The Best Simple Gold Indicator AroundBy
Wednesday, November 4, 2009
Just over 2% per year... that's all gold has gained since the end of 1979.
Gold sure hasn't done much. If you look over the last 41 years, gold performed better... about 8% per year. It did well in the 1970s because of inflation fears – similar to fears we have now. Then gold did nothing for the 1980s and 1990s. Today, I'll share with you an incredibly simple gold indicator that does an amazing thing... It captures the upside in gold, and it actually makes money when gold does nothing. For the conclusion up front, this chart tells the story... The gold line is the price of gold, and the black line is the simple gold indicator. If you invested $10,000 using this indicator, it turned into $1.28 million. 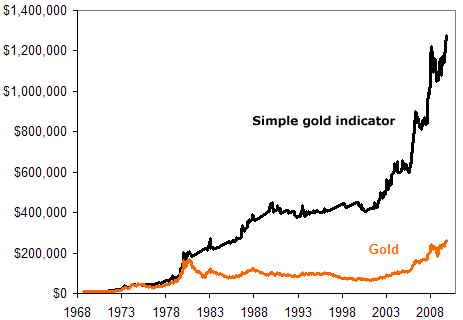 As you can see, the gold indicator kept up with the price of gold in the 1970s... Then when gold went to sleep for 20 years, this indicator kept making money. And now that gold is going again, you're making big money. The indicator is incredibly simple, too... It requires less than an hour of work a year to follow. Yet, since 1968, when this indicator said "buy," the price of gold rose at a compound rate of over 17% per year. And when this indicator said "move to cash," gold fell at a compound rate of worse than 2% per year. The indicator is simple. You look at the price of gold once a month. You buy (or keep holding) if the price of gold is above its nine-month average. And you move to cash if it's below its nine-month average. There's nothing magical about the nine-month average, by the way... You can use the eight-month, 10-month, and 11-month averages for "buy" signals, too. Same goes for the "move to cash" signals. Testing this indicator since the end of 1979 gives similarly good results. In "move to cash" mode, the price of gold lost about 3% compounding per year. And in "buy" mode, gold gained around 7.5% compounding per year. While 7.5% compound annual gains in buy mode since the end of 1979 doesn't sound as sexy as 17% a year since 1968, keep this in mind: Without this indicator, gold has only compounded at 2.3% a year since the end of 1979. I've loaded you up with numbers here, but the concept is actually simple... Own gold when it's above its nine-month average. Move to cash (earning interest) when it's below its nine-month average. Doing this simple thing since 1968 would have turned $10,000 into $1.28 million – for a compound annual gain of 12.5%. The secret to the indicator, of course, is that it limits the pain of your bad years. Consider this table of the 10 worst 12-month periods for the price of gold compared to how the simple indicator performed during those 12-month periods. Gold lost over 30% in every case. The worst the indicator performed was a 3% loss. Take a look:
I can't take credit for this simple indicator. My friend Mebane Faber wrote about a similar system in his book, The Ivy Portfolio. In that book, Meb describes why it works: "When markets are declining people become more fearful and use a different part of their brain than during periods when markets are going up," he writes. So the reason it works is "rooted in human psychology." Meb says it's "simple" and "timeless." And he's right. You can make it a lot more complicated. But simple is elegant. A few minutes a year turned $10,000 into $1.28 million over 41 years, without any number gymnastics. Why make it more complicated? Right now, the simple gold indicator says "buy." Good investing, Steve P.S. Meb Faber will be speaking on Monday at our Stansberry Research Alliance Meeting in Kiawah, South Carolina. I look forward to seeing many of you there.
Further Reading:
This System Works So Well, I'm Not Sure I Should Tell You About It Market NotesTHIS IS THE WORLD'S BEST PAIRS TRADE
Yesterday, we studied one of the great "pairs trades" of the last decade... shorting the old movie rental business model (Blockbuster) and buying the new movie rental business model (Netflix).
Today, we study a pairs trade that compares the "old" way of viewing paper currencies with the "new" way of viewing them. In the past several years, we've read all kinds of analysis on why gold does what it does... essays on interest rates, central bank gold holdings, and Indian wedding-season demand. But what gold's bull market really comes down to is folks just don't trust governments, giant welfare giveaways, bailout boondoggles, and the paper currencies behind the charade. Folks know what the yahoos in Washington D.C. do not: You can't tax, regulate, and spend America to prosperity. Folks know "there ain't no such thing as a free lunch." This knowledge is driving wealth out of vulnerable paper money and into real, honest money – gold... And it's driving the phenomenally successful pairs trade of "long gold, short U.S. dollar" you see below. 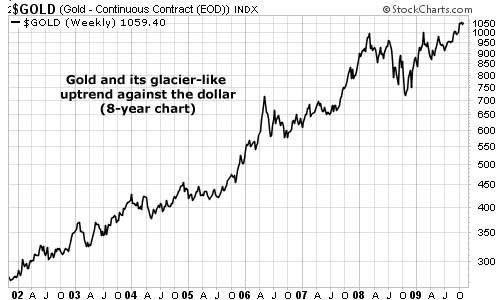
|
In The Daily Crux
Recent Articles
|


