| Home | About Us | Resources | Archive | Free Reports | Market Window |
One of the Greatest Tools Available to You as an InvestorBy
Thursday, November 19, 2009
Red sky at night, sailors delight,
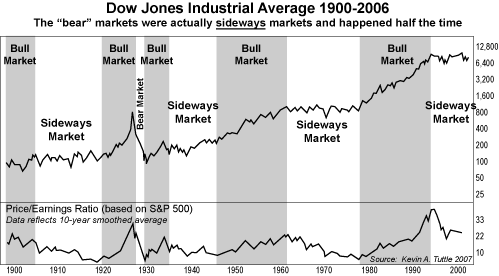
Red sky at morning, sailors take warning. The old sailor's rhyme is quaint, but true. If you see red sky in the west as the sun sets, a storm is moving away from you. If the eastern sky is red as the sun rises, look out – trouble is coming your way. The rhyme holds true as a weather forecasting tool because of the way storms move through the atmosphere. That's what the red sky is: moisture and particles in the atmosphere, a possible storm system in the distance. A version of the rhyme has been around for thousands of years. The biblical version appears in the book of Matthew. Jesus is criticizing the Pharisees and says, "O ye hypocrites, ye can discern the face of the sky; but can ye not discern the signs of the times?" Investors are like that sometimes, too. They're wrapped up in predicting the next bull or bear market. They don't ask whether stocks – which are just pieces of a business after all – are priced for an adequate return or not. (It's "not" these days.) Like the Pharisees in the book of Matthew, investors try to discern the face of the sky, but can't discern the signs of the times. I want to give you a tool, a way of looking at the overall market that will hopefully supplant the ubiquitous bad habit of trying to predict whether it'll go up or down in the next few days, weeks, or months. I've found what I believe is the best way to establish a rational expectation about stock valuations over the next five to 10 years. If you stick with this tool and forget about predicting the market's ups and downs, you'll do much better than the traders likely to get whipsawed badly in the next few years. You'll find the tool below, in my version of a graph created by Kevin Tuttle of Tuttle Asset Management. I found the original graph in a presentation by my friend Vitaliy Katsenelson of Denver-based Investment Management Associates. Vitaliy wrote a good book called Active Value Investing.  The chart doesn't show you bull and bear markets... It shows you all the bull markets and sideways markets from 1900 to 2006. (Nevermind the bear market of 1929-1932. It's the exception to the historical rule.) So forget about bear markets. And forget about bull markets for several years. The only rational expectation for the next several years is a sideways market, just like the ones you can plainly see between every bull market on the chart. On the bottom of the chart, you'll find changes in the price-to-earnings ratio of the market. Notice how the valuations fall over the life of a sideways market. Take a look at any one of the sideways markets on the top chart and match it up with the P/E ratio chart at the bottom. You'll see stocks starting out expensive and ending up cheap. Stocks usually start going sideways at or above 20 times earnings. Sideways markets usually finish with stocks at or below 10 times earnings. The 100-year average P/E ratio of the S&P 500 is 16, about in the middle of the sideways market's general range. Right now, there's little doubt about what's happening. The entire U.S. market is trading at 29 times earnings. We're nowhere near the end of this sideways market. So if you must obsess about the market, now you know how to do it. Forget about momentum. It'll kill you in a sideways market. You'll always be selling when you should be buying and vice versa. Focus on the overall market's valuation, not its direction. That'll give you an advantage over the momentum crowd. Stocks have been going sideways since 2000. Back then, stocks reached their most expensive valuation ever, up around 40 times earnings. I believe there's a good chance you'll see the overall stock market get cheaper than anytime in history before the current sideways market comes to an end. Markets tend to swing like a pendulum. When they swing too far in one direction, they swing about that far the other way. The pendulum never swung as high in the bull market direction as it did back in 2000. It ought to correct about that far in the opposite direction. So maybe we'll see stocks down around five or six times earnings in five or 10 years. Perhaps the Dow Jones Industrials will yield somewhere around 8%-10%. Again, I'm not trying to make specific predictions. I'm not predicting a crash. I'm simply stating there is a load of evidence that bull markets start when stocks offer great values. Markets go down or sideways when they do not. This means you should be extremely picky about buying only the highest-quality businesses at reasonable prices. I've written about some of my favorite ones, like ExxonMobil and Procter & Gamble, several times in these pages. You're going to make far more money in these stocks than buying an S&P 500 fund on a "momentum play" and hoping some fool will pay you a higher price for it. An era of "sideways" is upon us. When the pendulum swings back to great values, it will be time to buy as much stock as you can afford. And above is the tool to use to know it's here. Good investing, Dan Ferris Editor's note: Dan Ferris is the editor of Extreme Value, an investment advisory focused on the safest, highest-returning stocks in the world. In his most recent issue, he covers the market's best value and safest stock. This company makes so much money and has enough balance sheet cash, it could purchase all of its outstanding common shares. It's also arguably the safest credit risk in the world, even safer than Warren Buffett's Berkshire Hathaway. Click here to learn more about Extreme Value.
Further Reading:
Why You Should Cheer the Most Hated Company in America Market NotesWHERE THE BULL MARKETS ARE
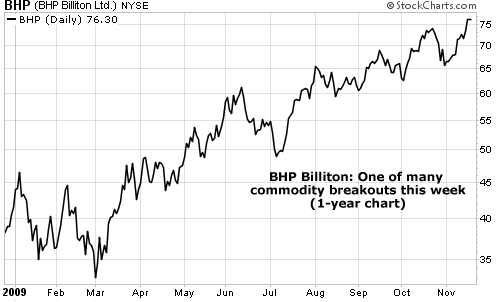
Breakouts. Everywhere we look in the commodity markets, we see breakouts.
Breakouts are one of the great "common sense" charting tools available to traders. It's simply when the price of a stock or commodity reaches a new high for a given period of time. No trend can start without one. Here's this week's list of major commodity stock breakouts, aka, "where the bull markets are": BHP Billiton (world's largest mining company), Silver Wheaton (largest silver royalty company), Peabody Energy (largest public coal company), the Market Vectors Agribusiness Fund (food and fertilizer producers), Petrobras (Big Oil). And don't forget a fresh high in the Venture Index as well. How about the commodities themselves? Try copper, gold, silver, and platinum. Crude oil, lead, aluminum, zinc, cotton, and sugar are within spitting distance of breakouts as well. In addition to a bullish supply/demand picture, legendary investor Jim Rogers likes commodities because of the potential inflationary explosion the Federal Reserve is creating. As you can see from the chart below, he has the trend on his side. 
|
In The Daily Crux
Recent Articles
|

