
Not a subscriber? Click here to learn
more.
|
| Home | About Us | Resources | Archive | Free Reports | Market Window |
We Just Got a Buy Signal from My Favorite Oil IndicatorBy
Saturday, June 12, 2010
It's time to lean over and pick up the cash... again.
The last time this happened, I gave my Advanced Income readers three trades. We earned 25%, 27%, and 30% in just one week.
It was March 16, 2009. Stocks were suffering from a vicious selloff. Every sector was getting hammered. And the oil stocks were especially weak.
Investors were stampeding away from the market. They were leaving a trail of crumpled value stocks in their wake. And they were willing to pay huge premiums to gain any sort of protection from further downside risk.
Profiting from selling options at that time was as easy as leaning over and picking up a pile of cash. So that's what we did.
We took advantage of the fear in the market and a "buy signal" from one of my favorite technical indicators. We sold expensive options on three stocks in the oil sector, immediately generating high income. And we closed out the trades one week later for large gains.
Get ready for these same kinds of gains today.
Stocks are getting crushed right now. Investors are stampeding away from the market. Option premiums are enormous. And we just got a buy signal from my favorite oil-sector trading indicator.
A bullish percent index (BPI) measures the percentage of stocks in a sector trading with bullish patterns. It works best to define overbought and oversold conditions, and to indicate when a sector is vulnerable to a reversal.
For example, in the oil sector, the bullish percent index is overbought when it rallies above 80 (meaning 80% of the stocks in the sector are in a bullish formation). The sector is oversold when the BPI drops below 30 (meaning only 30% of the stocks in the sector are in a bullish formation). Take a look at the chart...
 Sell signals, highlighted by the red circles, occur when the energy sector's BPI rallies above 80 and then turns down and crosses below its eight-day exponential moving average (the "EMA" is the blue line on the chart above). Buy signals (green circles) occur when the BPI drops below 30 and then turns up and crosses over the eight-day EMA.
Now here's a chart of the AMEX Oil Index (XOI) with circles indicating the timing of the BPI trading signals...
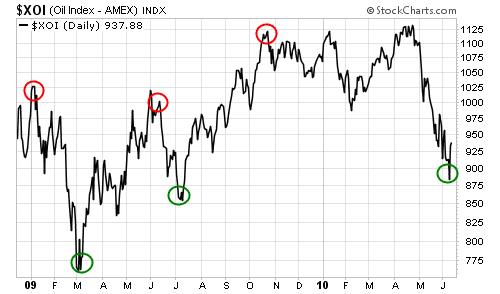 Not a bad track record. Selling or shorting oil stocks on the red circles and buying them on the green circles was profitable for each of the past five signals.
The oil sector BPI just flashed another buy signal. It's time to buy some oil stocks.
I know what you're thinking... The stock market looks horrible. Europe is on the verge of an economic collapse. Oil is spewing into the Gulf of Mexico. And everybody else is telling you to run for cover.
That's not too different than what we were facing in March 2009. Back then, we took advantage of the situation by putting on a few trades in the oil sector. All of them generated big profits, fast.
There's nothing like a quick market decline to turn a speculative stock into a value play. Stocks that were too expensive and too risky to recommend a couple months ago are downright cheap today. And the premiums we can get from selling covered calls are large enough to offset most, if not all, of any remaining downside risk.
Even though the market is in turmoil and it feels like the risk is high, buying beaten-down oil stocks and selling covered calls against them today is far safer than it has been for most of the past year.
These setups don't come along every day. Take advantage of this one while you can. All you have to do is lean over and pick up the cash.
Good investing,
Jeff Clark
Further Reading:
"I love bad markets," Jeff writes in a recent Growth Stock Wire... "Bad markets cause option premiums to inflate faster than a rubber raft at a fourth-grader's pool party."
If you're not familiar with option trading, that might not mean much. But it's incredibly important – and with just a little bit more work than buying a stock, it can mean HUGE, instant income payments with LESS risk. Really. Find out more here: Earn 16% in the Next Month.
As well as Jeff does trading oil stocks, he's incredible at timing the gold stock sector. See how he's compiled a flawless record with gold stocks here: My Secret Gold Stock Timing System.
Market NotesCHART OF THE WEEK: GOLD IS SKYROCKETING! This week's chart is an update on our "take the global view" stance on valuing assets.
Longtime readers know we encourage folks to look at the world's assets through several different lenses. This exposes you to more knowledge, more perspectives, and thus, more opportunities.
One "lens" we're fond of is the price of gold as seen by a European. In U.S. dollar terms, gold is enjoying a modest uptrend. But in the eyes (and pocketbook) of a European, the price of gold is absolutely soaring in response to the deteriorating value of his paper money.
This is the market telling him "there's no such thing as a free lunch"... that the problem with massive nanny state socialism is, sooner or later, you run out of other people's money. Real wealth, as represented by gold, rises in response.
|
Stat of the week
4.72%
Interest rate on 30-year fixed-rate mortgages, according to government mortgage agency Freddie Mac... just above the record low of 4.71% set in December 2009.
In The Daily Crux
Recent Articles
|


