| Home | About Us | Resources | Archive | Free Reports | Market Window |
Turn $10,000 into $2 Million with My Simple Gold StrategyBy
Thursday, July 15, 2010
I came up with a Simple Strategy to tell you when to own gold... and when not to.
It's so simple, you could teach a monkey to follow it.
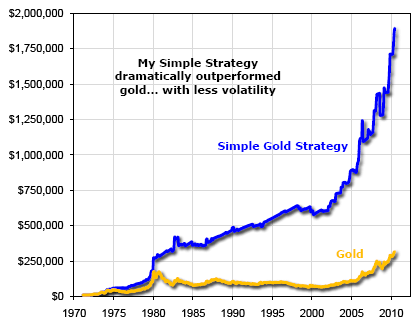
Best of all, $10,000 invested in this Simple Strategy would have turned into nearly $2 million. Just buying and holding gold over the same time period would have turned $10,000 into just $300,000.
The chart here tells the story... The blue line is the Simple Strategy. The gold line is the price of gold:
 Not only did this Simple Strategy dramatically outperform the price of gold, it did so with substantially less volatility...
My Simple Strategy managed to steadily rise from the lower left of the chart to upper right. It almost entirely avoided gold's big fall in 1975-1977. And it generally avoided gold's two-decade fall from 1980 to 2000.
The Simple Strategy is so simple, it's almost embarrassing. But it is based on an important point. Let me explain it...
How do you know when it's a bull market in gold? Sometimes people will say, "Oh, it's not a bull market in gold... It's simply a bear market in the dollar."
You see, if the U.S. dollar is crashing against other currencies, it's probably also going down in terms of gold. That can make it look like gold is in a bull market. But what if gold is falling in terms of the euro or the yen? That's not a gold bull market.
So what is a bull market in gold?
One simple definition is: when gold is going up in terms of the world's most important currencies. I took a look at the four most widely traded currencies... the U.S. dollar, the euro, the British pound, and the Japanese yen. And I came up with my Simple Strategy. Here's how it works:
If gold is up versus all four currencies over the previous month... buy gold. Repeat the next month.
That's it.
When I tested it over the last 40 years of data, the results were astonishing... When gold was up versus all four currencies in the most recently ended month – when my Simple Strategy flashed a buy signal – gold rose at a compound annual rate of 35%. My Simple Strategy was in buy mode about a third of the time. (All the rest of the time, astoundingly, gold lost money.)
If you simply bought gold when you got a signal and then switched to cash (Treasury bills) when the signal was off, you'd have turned a $10,000 investment in 1971 into nearly $2 million today.
Since 1971, the price of gold has risen at a compound annual rate of 9.2% a year. By using this much less volatile Simple System, where you're invested in gold about one-third of the time, your wealth would have compounded at 14.5% a year.
This system is simple, but it's sound... History shows that a great predictor of when gold will go up is when it's already going up versus the major currencies.
It would be easy to refine my Simple Strategy to produce more dramatic results (and chances are we will for a future product we're working on). Or you could leverage it up with a double-long gold fund, for even bigger profits.
But at the very least, now you know how to find out if conditions are bullish for gold.
In case you're curious... we're in a bull market in gold... and we have been since March. Each month, gold has been up against all four currencies. Trade accordingly.
Good investing,
Steve
Further Reading:
Back in May, we ran a two-part series from Steve giving readers the inside story on gold investing from a legend in the business...
Find out the absolute best way for the typical American to hold gold here: How to Buy Gold, Part I: Famous Dealer Explains. And read our advice on what to do if you're just starting out in gold, or if you'd like to add more money to your gold position, here: How to Buy Gold, Part II: Three "Must-Own" Gold Investments.
Market NotesTHE CONTRARIAN TRADE OF THE WEEK Contrarian traders take note: The huge wipeout in offshore drilling companies has exhausted itself.
For a picture of this exhaustion, we look at the past 12 months of trading in offshore driller Diamond Offshore (DO). Diamond Offshore is one of the world's leading drilling contractors. The legendary Tisch family investment dynasty owns a huge portion of the company. Its rigs can command rates of over $500,000 per day.
To the right side of the chart, you'll see the "Deepwater Horizon effect" on Diamond's shares. The Gulf of Mexico drilling disaster and worries over lost earnings caused incredible declines throughout the drilling sector... including Diamond, which lost 35%.
Now note how Diamond shares have dug a "toehold" in the $60-per-share range and staged a modest rally. Also note that the stock trades for less than eight times earnings... and note that on Friday, Diamond became the first company to send a drill ship out of the Gulf of Mexico in response to the drilling ban. It will soon be at work off the coast of Africa.
|
In The Daily Crux
Recent Articles
|

