| Home | About Us | Resources | Archive | Free Reports | Market Window |
Which Is It? Are Stocks Cheap or Expensive?By
Wednesday, May 25, 2011
I'm seeing the best values in my entire career.
I showed my True Wealth readers why in the latest issue, which just came out. And I gave you a peek into my thinking in yesterday's essay.
I say stocks are cheap. But many other intelligent analysts call them expensive.
How is this possible? Let me explain it...
How do you judge whether a company is expensive? The most common way is to look at the company's earnings and compare that to its price. In short, you don't want to pay too high a price relative to earnings.
So the price-to-earnings (P/E) ratio is the simplest way to size things up. But there's a problem with the standard P/E. Sometimes, it goes up when it should go down.
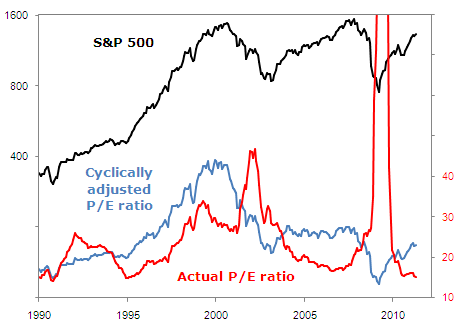
You can see it in the chart below. In 2003 and 2008-09 prices were falling, but earnings were falling faster. That made the P/E ratio (the red line) go sky-high... even though stocks were an incredible deal.
 So analysts latched on to economist Robert Shiller's idea of the "cyclically adjusted P/E ratio," aka CAPE (the blue line), to solve the problem. In 2003 and 2008, the CAPE was much better than the regular P/E at showing how stocks were cheap.
Today, Shiller's CAPE shows stocks are pretty expensive. So many analysts are saying now is a bad time to buy.
But there are also a couple problems with the CAPE...
If you're a numbers person, I'll show you what they are. If you're not, skip down a couple paragraphs and I'll show you why I think stocks ARE cheap... and what I recommend you do now.
Problem No. 1 with the CAPE is that we're looking 10 years into the rearview mirror to figure out where we're headed. You see, CAPE takes the average earnings over the last 120 months (10 years), adjusts them for inflation, and then uses that number to create a P/E ratio for today. So 2001's earnings count just as much as yesterday's.
Problem No. 2 is that the CAPE will be artificially high for eight more years, until 2019. Earnings were incredibly low for most of 2009. That will force the CAPE to stay high until we're no longer including 2009 numbers in the average... And then, when the incredibly low earnings of 2009 finally fall off the CAPE calculation, the CAPE will all-of-a-sudden be low.
Knowing 2009 was a disaster for earnings, I don't want 2009's earnings to figure into my thinking about whether stocks are a good value here in 2011.
So here's what I see...
The stock market index (the S&P 500) is around 1,300 as I write. And analysts expect earnings of $100 for the index this year. So it's trading at a P/E ratio of 13. That, my friend, is cheap – as cheap as stocks have been in 20 years.
The last two times stocks were almost this cheap was 1990 and 1994. Stocks soared after those lows. And right now is even better than back then...
You see, back in 1990 and 1994, bonds were a better deal than stocks. Interest rates on government bonds were 7%-8%. Why take the risk of stocks when you could earn 8% nearly risk-free?
Today, government bonds pay less than half of what they paid 20 years ago. In short, because interest rates are so low today, stocks are a much better deal than bonds.
Many intelligent analysts say the stock market is expensive. They rest their case on Shiller's CAPE. While the CAPE has a good historical track record of usefulness, the fact that it looks 10 years into the rearview mirror is a liability at this particular time... The bust of 2009 is making it artificially high (and will for several more years).
Looking forward, I see incredible value out there today. And when I see this value combined with ultra-low interest rates, I'm convinced stocks are cheap.
You may disagree with me. But I'm buying...
Good investing,
Steve
Further Reading:
Yesterday, Steve showed you why he believes stocks are actually the cheapest they've been in decades. Check out these recent essays for more:
This group of stocks experiences "incredible booms and busts," Steve writes. "If you catch a boom, you can make some serious profits."
While the price of gold is up more than 60% over the last three years, this gold investment is up just 20%. And it's cheaper today than it's been in the last 40 years.
Market NotesTHE GREATEST CURRENCY TRADE OF THE MILLENNIUM Big news in the gold market: Gold just breached an all-time high, from a European's perspective.
On May 4, we pointed out how the oversold, universally hated U.S. dollar had dug a "foothold" in at 73 and was due for a "relief rally." That rally has arrived... and the dollar has snapped back. This "dollar up" action has pushed the price of gold down a bit. But there's more than one side of gold story, one Americans aren't hearing right now...
The story is that the U.S. dollar isn't the only currency issued by pandering, spendthrift bureaucrats. Across "the pond," the pan-European currency is selling off due to severe government debt problems. As you can see, this euro weakness has sent gold to an all-time high against the euro.
The story here is one our colleague Chris Weber termed "The Greatest Currency Trade of the Millennium." It's a trade that profits when governments around the world take on debts and obligations that can't possibly be paid back with sound, honest money. Their "IOUs" (paper money) fall relative to "real money" (gold), as a result. It is by far the strongest trend anywhere in the financial markets.
|
In The Daily Crux
Recent Articles
|

