
Not a subscriber? Click here to learn
more.
|
| Home | About Us | Resources | Archive | Free Reports | Market Window |
The Most Important Chart in All of FinanceBy
Friday, October 5, 2012
Two and a half years ago, I wrote a DailyWealth essay titled "The Most Important Chart in the World Right Now."
In it, I explained why the staggering U.S. debt was so dangerous... and how to track exactly how much damage it was doing in one simple chart. As I wrote then, "more important than understanding the size of [the country's] debt, it's vital that you understand its effects."
In today's essay, I'll show you what the chart looks like now (it's worse than ever) and the simple steps you need to take to protect yourself...
In the last three years, the government has tripled the size of the U.S. banking system's monetary base. Worse, Federal Reserve Chairman Ben Bernanke recently pledged to expand his policy through continuous reserve purchases on a scale that effectively provides cover for the entire annual federal deficit.
This sets the stage for massive future increases to price inflation in our economy... and will eventually cause a massive bear market in bonds.
Admittedly, my call for a collapse in bonds back in 2010 was premature. I didn't anticipate how the Fed could prop up the market and force down yields through its own purchases.
Nevertheless, my core trading idea – to be long gold and short U.S. Treasury bonds – has continued to be profitable.
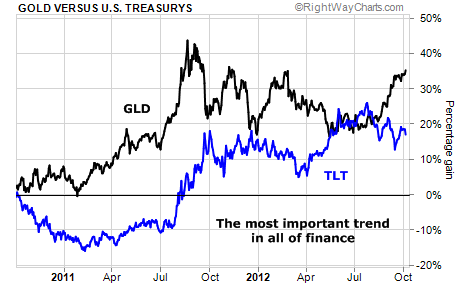
Below, you'll find a two-year chart of the price of gold – represented by the bullion fund SPDR Gold Shares (GLD) – and U.S. Treasury bonds – represented by the U.S. 20+ Year Bond Fund (TLT).
As you can see, even though bonds have rallied in the last two years (up 20%), gold has rallied far more (up 35%). I continue to believe this is the most important chart and most important trend in finance.
 Over the last five years, the price of gold has gone up about 130% – thanks almost entirely to the efforts of the Fed and the European Central Bank to inflate away their debts and finance their deficit spending with paper money. Incredibly, the U.S. long bond has gone up, too – by about 40%.
Bonds continued to go up for two reasons. First, when the Fed increases the money supply by purchasing new reserve assets, it typically buys government bonds. In the short term, this forces bond yields down (and pushes bond prices higher). Speculators, anticipating the Fed's actions, amplify this effect.
Second, most investors don't understand the monetary risks of the bond market and view bonds simply as a safe haven. As investors have sold stocks in fear, they've bought bonds in a misguided attempt to reduce the risks in their portfolios.
I cannot predict when the collapse in the bond market will begin. But I know it must collapse. Bernanke has deliberately destroyed the underlying monetary conditions that created the huge bull market in bonds.
By watching the price of gold as compared with bonds, you can see the pressure building on the bond market. The higher gold goes... the more pressure mounts. Sooner or later, these inflationary pressures will spook the holders of U.S. sovereign bonds. And when they decide to sell, it will cause a catastrophe.
All the bond markets in the world – all other sovereign bonds, all mortgage bonds, and all types of corporate bonds – derive their prices through comparison with the U.S. Treasury 10-year "benchmark" bond. As U.S. credit goes, so goes the value of paper money all around the world.
These risks are something few people appreciate today – as is evidenced by the huge inflows into the bond market and the soaring assets under management in Fidelity's fixed-income products. No, I do not expect an imminent collapse in the world's bond markets. But I do believe such a moment approaches.
I recommend hedging your exposure to fixed-income assets with gold and silver. Likewise, in this market, I would prefer to own high-quality, dividend-paying (and dividend-growing) stocks as opposed to low-yielding corporate debt. Finally, and most important, I would avoid all long-dated government bonds.
Good investing,
Porter Stansberry
Further Reading:
"The Fed just destroyed the bond market," Jeff Clark wrote last month following the announcement of QE3. "Bond investors don't have anything good to look forward to anymore." But traders do. Read Jeff's favorite trade here.
Steve Sjuggerud believes Bernanke has laid his cards out on the table. "We know his intentions. We expect his actions can and will drive asset prices to crazy levels," he writes. "You have to position yourself for this..." Find out what Steve recommends doing here: The Fed Gave Us the Playbook... Now It's Up to You to Profit.
Market NotesNATURAL GAS IS STILL A BARGAIN Natural gas is up 79% in just six months…
It bottomed in April at about $1.90 per mcf (thousand cubic feet). Today, it's trading at $3.40. Despite the big rally, natural gas is still cheap on an historic basis relative to oil…
Today's chart compares the price of natural gas to the price of oil. Historically, these energy cousins have a 10-to-1 relationship. That means it takes about 10 units of natural gas to buy one unit of West Texas Intermediate crude oil. That ratio reached an all-time high of 55 in April. Now, it has fallen to a more reasonable level near 25. But that's still much higher than usual.
One of three scenarios has to happen to bring the ratio back in line. Either (1) the price of natural gas must rise… (2) the price of oil must fall… (3) or some combination of the two.
– Jeff Clark
 |
In The Daily Crux
Recent Articles
|


