
Not a subscriber? Click here to learn
more.
|
| Home | About Us | Resources | Archive | Free Reports | Market Window |
Another Reason Why the 'Melt Up' Can Move Much Higher From HereBy
Friday, August 25, 2017
When does it all end?
When will the "Melt Up" be over... and the meltdown begin?
I know you're worried about this question. I am, too.
My team and I have worked long and hard finding the answer. And today, I'll share one simple reason why the Melt Up isn't over yet... and why stocks can still move much higher.
Last month, I showed you one simple way to see a dying bull market. The advance/decline line – a measure that shows if more stocks are going up than down – was a warning sign at the end of the 1990s boom.
The advance/decline line is signaling "all clear" for now. And another similar measure also says the market is healthy today. Here are the details...
Today's indicator is the S&P 500 Equal Weight Index. You see, the regular S&P 500 is "market-cap weighted." That means the largest companies get a larger weighting.
Consumer-electronics titan Apple (AAPL), for example, has a nearly 4% weighting in the S&P 500, even though the index typically holds 500 companies.
Those kinds of outsized weightings mean that, at times, the overall market can rise while most stocks in the S&P 500 are falling.
So in addition to monitoring the regular index, we can confirm the overall market's movements with this equal-weight index. Every stock is equally weighted, regardless of size. This equal-weight index should mirror the S&P 500 when we're in a healthy bull market.
And again, this indicator told us the market wasn't healthy at the end of the tech boom. Take a look...
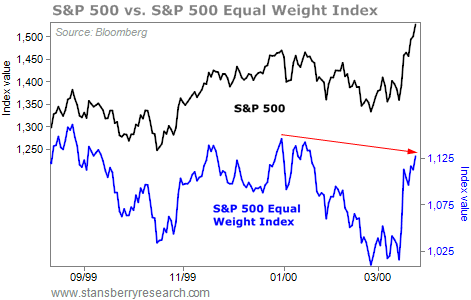 The S&P 500 Equal Weight Index was hitting "lower highs" when the overall market peaked in 2000. It was 6% below its 1999 high as the overall market hit new highs. That was a major warning sign for the market. And the same thing happened in 2007...
The index hit a lower high as stocks peaked. The majority of stocks had stopped moving higher. And the final Melt Up gains all happened in what was overall a weak market.
This isn't happening today... yet. Take a look...
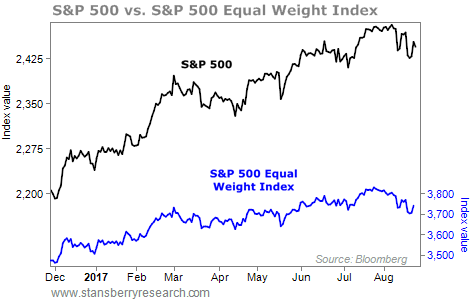 The chart shows that the S&P 500 and the S&P 500 Equal Weight Index are moving together today. They're both coming off all-time highs. It will be a warning sign if the overall market hits a new high and the S&P 500 Equal Weight Index doesn't. But that's not happening today.
Stocks are still broadly moving higher. The bull market remains healthy.
The Melt Up is still intact... So my advice is simple: Stay long.
Good investing,
Steve
Further Reading:
Catch up on Steve's latest market musings here...
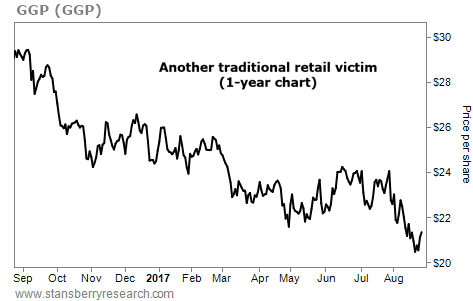
Market NotesRETAIL TURMOIL WEIGHS HEAVILY ON THIS MALL OWNER Today's chart highlights the next victim in the retail bust...
As regular readers know, the brick-and-mortar retail sector has been struggling as more consumers turn to online shopping. Retailers are seeing major foot-traffic declines and are regularly reporting sinking sales. Many are filing for bankruptcy.
With 127 properties in 40 states, GGP (GGP) is one of the largest mall real estate investment trusts in the U.S. But the company is highly dependent on failing tenants like Macy's (M), JC Penney (JCP), and Sears (SHLD). This year, those department stores are closing nearly 600 stores combined. That means lots of vacant space and no rent for GGP...
As you can see below, GGP shares are breaking down. They just hit a three-year low. Last September, Porter's team recommended shorting the stock in Stansberry's Investment Advisory. Readers who followed that advice are sitting on gains of more than 20%. Congratulations to Porter on another great call...
 |

Recent Articles
|


