
Not a subscriber? Click here to learn
more.
|
| Home | About Us | Resources | Archive | Free Reports | Market Window |
Danger Sign? Small-Business Optimism Just Hit a 34-Year HighBy
Tuesday, December 19, 2017
Uh-oh...
Longtime readers know that the best time to buy stocks is when people are scared... You want to "buy when there's blood in the streets."
Small-business owners are a good gauge of this...
During the past 34 years, the lowest-ever reading in small-business optimism was at the bottom of the market in March 2009. People were scared.
It was the exact right time to buy stocks. You know what happened after that – stocks have done practically nothing but go straight up for almost nine years.
And after all those years of good times in stocks, we've reached the opposite situation...
Small-business owners are as positive about today's outlook as they've been in 34 years.
The question is: What does that optimism mean for the future?
Is it good or bad for the economy?
And more importantly, will this be what kills our nine-year bull market?
The short answer is that despite near-record optimism, stocks can still move higher from here.
Let me explain...
The U.S. economy continues to improve slowly. Growth has been steady around 2%-3% for years. And small businesses are starting to feel the benefits.
We can see this by looking at the Small Business Optimism Index – a monthly survey of small businesses across the U.S. These businesses provide information on their plans to hire, expectations for future sales, and overall business outlook.
The result is a useful gauge of how small businesses are doing... and how they expect to do in the months ahead.
This indicator broke above 105 – an extremely high historical level – in November. That pushed it above its most recent highs in 2004 and 2005.
In fact, small businesses are as confident today as they've been in 34 years. Take a look...
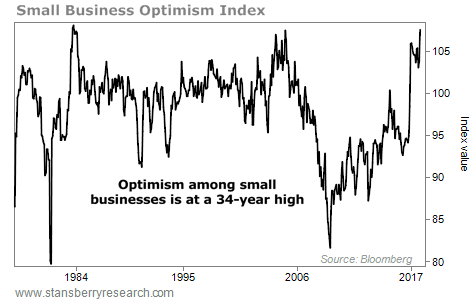 You can see how rare readings above 105 are. They have only happened a few times over the past four decades... We saw the index jump above 105 in 1983. Then it happened again – once in late 2004, and once in early 2005. We saw another jump above 105 last year... And now, we're seeing it again this year.
So what have these spikes meant in the past? Are they "signs of the top"?
Not quite...
If anything, these peaks were good for stocks and the economy in the years that followed. They certainly didn't signal immediate peaks around the corner.
For example, after optimism spiked in 1983, the S&P 500 Index returned triple digits in a little more than three years.
We saw a similar story in late 2004. The overall market jumped another 40% through mid-October 2007 after that peak. Of course, stocks collapsed soon after. But that was more than three years after the initial 105-plus reading.
The most recent example before now was in December last year... And stocks are up 22% since then.
In short, high optimism by small-business owners isn't the obvious negative sign for stocks that a contrarian investor might expect it to be.
Instead, extreme optimism in small-business owners is a sign the economy is healthy... and that we could have a few more years of gains ahead of us in the U.S. market.
We're closer to the eventual top today than we were last year... But that doesn't mean a crash is imminent. The best advice today is to stay long stocks.
Good investing,
Brett Eversole
Further Reading:
"You know what the end of a great bull market looks and feels like," Steve says. Learn why we're not at the top of this boom – and why the biggest gains are still ahead – right here: A Major Change to My 'Melt Up' Script.
"We have a simple way to know when this boom will end," Steve writes. One key indicator has predicted the end of every stock market boom over the past 30 years. Read more here: This Will Cause the Next Stock Market Peak.
Market NotesTHE HYPE IS GONE... NOW SHARES CAN RISE Today's chart highlights the return of a social media giant...
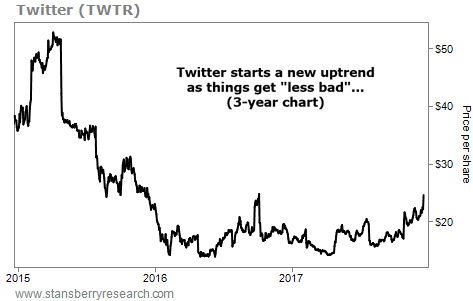
Regular readers know Steve coined the term "bad to less bad" trading several years ago. If you buy assets dirt-cheap when no one is left to sell, you can make massive profits as the market returns to normal – or in other words, when things simply get "less bad." Right now, we can see this taking shape in social media platform Twitter (TWTR)...
When shares of TWTR started trading in November 2013, many investors bought in aggressively. They believed Twitter would be the next Facebook (FB). But then the hype faded... And shares plunged more than 80% from their 2013 high to their 2016 low. Now, things are getting "less bad"... As of last quarter, Twitter's monthly active users reached 330 million. That's 4% higher than the third quarter of last year. And the site's daily active users jumped 14% over the same period.
As you can see below, Twitter may be poised for a rebound. Shares are up nearly 50% this year, and they're trading at new 52-week highs. Watch this stock for a big "bad to less bad" rally...
 |
Recent Articles
|


