| Home | About Us | Resources | Archive | Free Reports | Market Window |
How to Profit on America's New Era of TurbulenceBy
Wednesday, February 10, 2010
There's a huge stock market opportunity setting up right now. This opportunity won't last long, so I urge you to start preparing immediately.
I call it "America's New Era of Turbulence." Big changes are taking place in America, and they're creating waves of volatility in the stock market that could last for years. Let me explain... It's a big deal when the stock market moves more than 5%, up or down, in one day. Since 1940, it's happened on average only once in every 734 trading sessions. But get this: In the 1930s, it happened 95 times. Between 1940 and 1970, it only happened three times. By this measure, there was great period of volatility in the stock market for 10 years during the Depression and then no volatility for 30 years. I analyzed the number of 5% moves in the Dow Jones Industrial Average since September 1929. By this measure, volatility was consistently low for decades. Then in 2008, it exploded again:
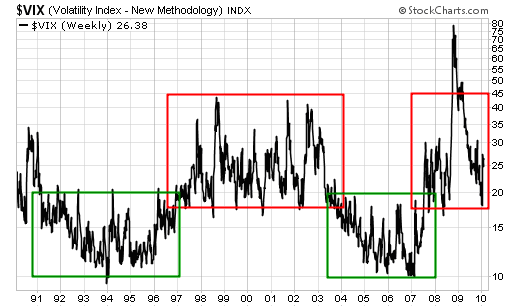
This table highlights the periods of turbulence quite nicely, but counting the number of 5% up and down days in the stock market is a crude method of measuring volatility and doesn't show you how durable these trends are once they get started. Here's a much better method... You've heard of an option. It's a financial instrument that derives its value from the price of another financial instrument, usually a stock, commodity, or bond. Volatility is the most important factor in option prices. To give you an example, you'd need to pay a much higher premium to buy an option on Apple, whose stock price might move an average 3% per day, than you would to buy an option on a piece of real estate, whose price might only move an average 0.1% a day. Because the price of the real estate is far more stable than the price of Apple's stock, the option on the real estate is less likely to soar in value, so it is cheaper. Volatility is the most important factor in option prices. Stock market statisticians can use option prices to generate a real-time measurement for volatility. You can even use options prices to infer the market's expectation for future volatility. In short, option prices generate the most accurate – and useful – measure for volatility. The best measure of volatility is called the Volatility Index ("the VIX"). It's an index of option prices on stocks in the S&P 500. This may sound confusing, but just think of the VIX as the benchmark measurement of volatility in America's stock market. To look up the VIX, type ^VIX into Yahoo Finance's quote box. Here's where it gets interesting... Stock market volatility tends to move in giant trends. You get long periods of almost no volatility, like the 1940s, 1950s, and 1960s. Then you get long periods of high volatility, like the 1930s. Check out this 20-year chart of the VIX. It's the perfect illustration of what I'm trying to say...  In the 1990s, there was a long period of low volatility (the left-hand green box). Then, from 1997 to 2003, we saw seven years of stock market mayhem as the Nasdaq formed a bubble and then popped (the big red box). Between 2003 and 2007, we had another quiet period where the market ambled along (another green box). But the market became wild again in 2008... culminating in the highest stock-market volatility in my lifetime. Volatility has fallen over 75% from the levels it reached in those wild days of 2008, but if I'm right about the long-term trends in volatility, then one of the best volatility trading opportunities I've ever seen is setting up right now... I believe you'll make a quick 50% gain in this trade, and with some luck, you could make as much as 100%... in a few weeks. In my next DailyWealth column, out on Monday, I'll show you exactly what you have to do to capture this opportunity... and the stock you need to buy to make the most of it. Good investing, Tom P.S. This trade was a recent recommendation in my trading service, Penny Trends. My readers are already up 15% in the trade, in just the last 7 days. This trade is flying, and I urge you to move as fast as possible here. If you sign up to my trading service, you'll get this information immediately. Click here for details. Market NotesTHIS MONSTER DOWNTREND IS NOW "EXHAUSTED"
A question comes into DailyWealth: OK... so the "China bears" are now in control. How can I make money here?
Answer: Take a look at the short China fund. It's displaying some classic "trend exhaustion." Below is the past 15 months of trading in the short China fund (FXP). This fund declines when Chinese stocks rise and rises when Chinese stocks decline. As you can see, this fund suffered a monster downtrend as Chinese stocks rallied in 2009. FXP falls when Chinese stocks rise, and it fell from over $180 per share to less than $8. Stocks and funds that have gotten this beaten down make some of the world's greatest trading vehicles. Even the strongest trends (down or up) "get sick." They get old and exhausted. When an asset is this depressed, it takes just a bit of "less bad" conditions to kick off a 50% rally. And as our colleague Jeff Clark noted in this brilliant essay, it can also create big opportunities for income investors... |
In The Daily Crux
Recent Articles
|
|||||||||||||||||||||||||

