| Home | About Us | Resources | Archive | Free Reports | Market Window |
|
Steve's note: This weekend's essay is by my friend Jason Goepfert. Jason does fantastic work on tracking investor sentiment, and I've been a subscriber of his for years. Read on for the details on a great opportunity he sees right now...
Sentiment Indicators Say Buy Stocks NowBy
Saturday, February 16, 2008
"Dad, why did you drag me out here?"
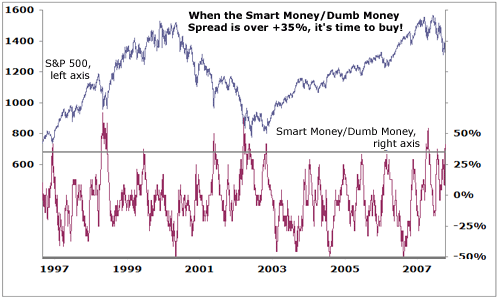
Good question, son... Last weekend, a couple hundred fishermen subjected themselves to 40-below windchill here in Minnesota... in the hopes of snagging a bigger fish than all the other poor saps in a local ice-fishing contest. My oldest son and I were some of the poor saps... After four sorry hours and not even a nibble, he hit me with the obvious question above. Not that he cared, but I told him that fishing is a lot like what I do for a living in the stock market... You go through long periods of sheer boredom, interrupted by periodic bouts of excitement – so you always have to be ready. The past few weeks in the market have been one of those "periodic bouts of excitement." As I'll show you today, based on my indicators, I think we're set up for a nice rally in stocks over the next six months... I measure investor sentiment. Sizing up people's emotions is difficult, of course. All I can do is size up the weight of all the evidence I collect, measure the historical performance and the probabilities, and share them with you. It's not perfect. But it can be extremely helpful, particularly when the evidence is strong. Right now, the weight of the evidence for a stock market rally is strong. Let me share some of it with you... The manic trading that can be characteristic of stock market lows started about three weeks ago, on January 22... Stocks tanked that morning after a French bank announced it lost billions as it uncovered a rogue trader. The selling pressure was so extreme, the S&P 500 futures contract locked at limit-down for a brief period. That's nearly unheard of. The only comparable instances in the past 20 years were October 19, 1987 (Black Monday) and September 17, 2001 (the first open after the 2001 terrorist attacks). Then the markets rallied impressively that day... only to tank again the next morning. That type of back-to-back excitement hadn't been seen in recent history. At that time, I saw many signs that were reminiscent of past lows. We scored yet another major intraday reversal that day. The probability of a short-term rally afterward looked high. In fact, stocks then had their best week in five years. I went back and looked at the "best week in five years" as an indicator, going back to the 1950s. It turns out, the indicator is a good one... For example, on average, six months after the best week in five years, stocks gain 11%. Stocks lost money only two out of those 12 instances. Going back to the 1970s, stocks made double-digit gains over six months in every instance but one. But the most important indicator I follow is even more bullish... Here's the basic idea: When the dumb money is scared, and the smart money is optimistic, it's time to buy. The wider the spread, the stronger the buy signal.
With the smart money currently at 67% and the dumb money at 25%, the spread between the two is now +42 points, wide enough to be considered extreme. Since 1997, there have been 124 trading days with a spread greater than +35%, and three months later the S&P 500 showed a positive return 89% of the time, with an average return of +10.3%. The few losers averaged -1.7% while the winners averaged +11.9%... quite a wide difference. Of course – we never get everything lining up perfectly at the same time. But given the status of the indicators and what I shared with you here, I expect the market should do well over the next six months. Volatility could be high. And if the market falls below its January lows, follow your trailing stops, as all bets would be off then. But based on the indicators I track, chances look good for a nice rally in the coming weeks and months. Trade accordingly! All the best, Jason Goepfert P.S. The guy who won the ice-fishing contest actually cheated – he caught his fish an hour before the contest officially began. But that's a lesson for my son for another day... Editor's note: To learn more about Jason's service, sentimenTrader, visit his website here.
Further Reading:
Recession Investing: The Right Time to Buy Market NotesAN INFLATION HEDGE YOU'VE NEVER CONSIDERED
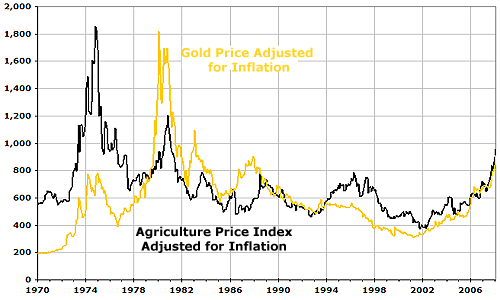
Government statistics are finally starting to signal what the price of gold has been telling us for years... inflation is creeping into our lives.
The government's measure of inflation, the CPI, rose at its fastest pace in 17 years in 2007... which helped gold gain 31% during the year. Gold has once again proved to be great protection against inflation. But one asset class has similar inflation-protection properties... an asset you've likely never considered.
|
Recent Articles
|


