| Home | About Us | Resources | Archive | Free Reports | Market Window |
Housing Prices: The Real TruthBy
Wednesday, December 14, 2005
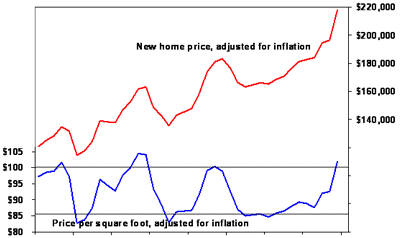
If I hadn’t crunched the numbers myself, I wouldn’t have believed it. “You can’t go wrong in real estate,” they say here in Florida. “Home prices always go up.” It’s basically true... but there’s a really big wrinkle here... One that I’ve never heard anyone talk about before. Yes, new home prices have basically trended higher since the early 1960s (as far back as we have decent data). Yet, when you look at home prices in “real” terms – meaning adjusted for inflation – a different picture emerges... In real terms, new home prices have trended higher since the 1960s, with a few downward blips. These downward blips have nearly always coincided with recessions. The red line in the chart below is “real” home prices, and you can see the general upward trend, along with the blips:
If you look at just the red line, you might still believe the conventional wisdom is correct... that new home prices generally rise over time. This misses an important (and little talked about) point... The size of new homes has actually increased significantly over time... Therefore, the real price of a new home per square foothas been pretty constant,between $85 and $100 per square foot. You can see it in the blue line in the chart above, or in the table right here:
Data source: NAHB.org In short, what people pay for a home hasn’t really gone up. People are simply buying bigger homes. I really wouldn’t have believed it myself. But the inputs above are simple, and not disputed: New home prices, the CPI (inflation), and the median home size. It’s not rocket science. “Home prices always go up,” they say. When you take out inflation, it’s not quite true. And when you factor in how homes have gotten bigger, it’s really not true. Said another way, the gains in new home prices over the last 35 years can significantly be accounted for by rising inflation and by the increase in square footage. There are little booms (like now) and little busts as well. One other conclusion we can take away from this chart is that new homes are as expensive as they’ve ever been, in terms of price per square foot, with the exception of the late 1970s. While housing prices could climb higher from here, this chart suggests we’re in the late innings of the housing game... If you’re over extended in real estate, it’s time to reel things back in. Good investing, Steve Market NotesMARKET NOTES Yet another example of the frenzy overtaking the oil and gas industry: Monday night, oil giant ConocoPhillips (COP) officially announced the $35 billion takeover of Burlington Resources (BR) – a move that will create the largest natural gas company in the United States. It also sent shares of Burlington Resources up 13% in just one day. Matt Badiali, our oil and gas expert, explains why this is just the beginning of a trend that could last through all of 2006: “If Big Oil wants to stay Big Oil, there’s only one thing they need – more reserves. And if they want more reserves, there’s only two ways to get it: Go out and find more, or buy it from someone else. Thanks to three years of soaring oil and gas prices, Big Oil’s got plenty of money to spend. And if you want to make money… just follow the money.” Just last week, Matt published a special report that explains exactly where he believes that money’s going next – so you can get there first. In fact, he’s found one opportunity that could easily return 200% in a single trading day. |
Recent Articles
|


