| Home | About Us | Resources | Archive | Free Reports | Market Window |
How to Get In Early On America's Next Great Commodity BoomBy
Saturday, November 13, 2010
If you're interested in safely making money in commodities over the coming decade, I have two important numbers for you...
The first is the price of natural gas in the U.S. – which is less than $4 per million British thermal units (mBtu).
The second is the price of natural gas in Asia, where people will pay $10 per mBtu for natural gas they import from overseas.
This is a disparity someone can make a lot of money on. The only reason it exists at all is because the natural gas market is still mainly a local market. It is not as easy to ship natural gas into a country as it is to ship oil. You have to supercool it so it liquefies. Then you can put it on a tanker and ship it to a terminal where your buyer can regasify it. This is the LNG trade.
There are problems. U.S. energy companies, before the shale gas boom changed everything, thought the U.S. would need to import natural gas. So the U.S. has about 10 LNG import terminals and two more in the works. Now, with a natural gas glut in the U.S., these terminals are pretty much useless.
Owners of these terminals want to refit the terminals to turn them into export terminals, where the gas is liquefied and shipped out. They are now petitioning the U.S. government for export licenses.
As the Financial Times reported, "The U.S. could soon be competing with Russia and the Middle East to supply the world with natural gas, a shift in production that would reshape energy markets over the next decade." Even if the U.S. exported just 10% of its natural gas, it would become the largest exporter of LNG in the world. Few countries can match the U.S. in natural gas resources or low costs.
So where will the natural gas go? This is an interesting question, because it yields some surprising answers.
I attended the ASPO conference last month in Washington, D.C. (ASPO stands for the Association for the Study of Peak Oil and Gas.) One of the more fascinating presentations was by Jonathan Callahan, founder of Mazama Science.
He looked at natural gas through the lens of the import/export markets. This is a good thing to do for any commodity because it can tip you off to what's happening in that market. When China went from being one of the biggest exporters of soybeans to the biggest importer, the effect on agricultural markets was huge.
Anytime a big exporter becomes a big importer, you can bet it spells opportunity for that commodity. China, for instance, remains a big importer of oil and iron ore, which has been good for investors in those commodities. China will very soon become a big importer of coking coal – which is used to make steel. So will India and Brazil. This is good to know if you're an investor, as it will drive demand for coking coal.
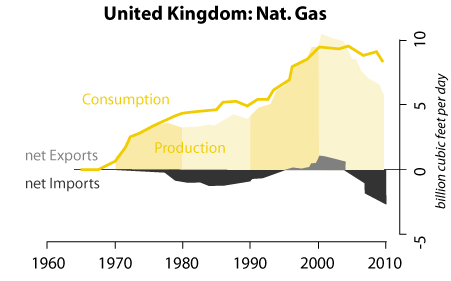
So Callahan looked at natural gas through the same kind of lens. He created these charts that capture the trends. For the U.K., it looks like this:
 You can see the U.K. was an importer of natural gas through the 1980s and 1990s. Then there was the North Sea boost, matched by a step up in consumption. Finally, as the North Sea supplies dwindle, the U.K. has gone deep in the red as an importer. This chart exhibits a pattern we see time and time again. Consumption is sticky and stubborn. It doesn't go down much.
Using this same analysis, Callahan looks at all the big producers and consumers of natural gas. The big buyers here are Japan, South Korea, and Taiwan. All of the gas they import comes from LNG tankers.
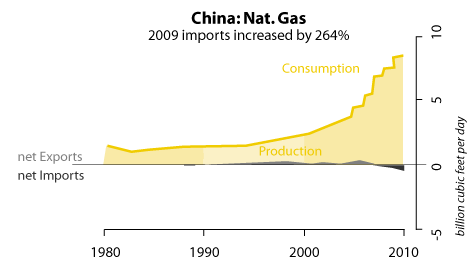
But what about, say, China? Here is another one of Callahan's charts. Note it is just starting to turn negative – which means China is just becoming a net buyer of natural gas. Per-capita consumption, Callahan points out, is only a fraction of China's neighbors'. He predicts – and I agree – it will soon be a huge importer of natural gas.
 Combine China with Japan, Taiwan, and South Korea and Callahan concludes, "Clearly, East Asian demand for LNG will not be letting up anytime soon."
Callahan's data suggest this trend is present all around the world... from the Middle East to South America to Europe.
The impact on the global market seems clear. "If shale gas doesn't turn out to be as prolific as hoped," Callahan wraps up, "we can expect to see increasingly expensive natural gas in the next decade. Forewarned is forearmed." (I encourage you to check out his website – mazamascience.com, where you can see his presentations and read his blog.)
So put together Callahan's data on exports and imports with the glut in the U.S. and the lack of export terminals. I think it's pretty clear we'll see more export terminals in the U.S. It's too big of an opportunity to ignore. The U.S. could become the leading exporter of natural gas in the next decade.
It's also pretty clear that worldwide, we'll see the LNG trade grow significantly to make up the shortfalls that are emerging in South America, Asia, Europe, and the Middle East.
It's a great time to buy infrastructure firms that build these plants. It's also a great time to look at companies with lots of North American natural gas reserves. With natural gas in the dumps right now, these assets are cheap... but they won't stay that way for long.
Regards,
Further Reading:
Chris is one of the best value-focused contrarian investors we know. Earlier this year, we featured an essay from him about the coming opportunity in uranium. You can read his analysis here.
Chris has also found value and opportunity in coal. Like many commodities, the big story here is rising consumption in China and other Asian nations. You can read Chris' thoughts on coal here.
Market NotesCHART OF THE WEEK: FAKE STOCK RALLIES AND THE AMERICAN WAY Last month, we ran a chart of the week called "The stock rally that wasn't." We noted how when you measure stocks in terms of gold, the giant September market rally didn't amount to much.
Americans love their cars… And they love access to huge quantities of cheap fuel. When that fuel rises in price, they howl. They'll suffer all sorts of indignities and humiliations from the likes of George W. Bush, Barack Obama, and Nancy Pelosi… as long as they get their cheap fuel. Our chart of the week uses this "gas love" to put perspective on the recent fake rally in stocks. It's a 12-month performance chart of the S&P 500 (blue line) and unleaded gasoline (black line). As you can see, stocks have rallied big off their September low. But this rally is simply a response to Ben Bernanke devaluing the U.S. dollar. You can see the price of gasoline has climbed in lockstep with stocks. Trying to translate your stock gains into more fuel? Fat chance! |
Stat of the week
15%
Increase in the price of unleaded gasoline since Ben Bernanke hinted at more "quantitative easing" (money-printing) on September 21st. In The Daily Crux
Recent Articles
|

