| Home | About Us | Resources | Archive | Free Reports | Market Window |
Don't Sweat the Correction in GoldBy
Saturday, November 19, 2011
I've told concerned investors that when the gold price falls, they should "come back in three months" and see if they're still worried. The idea is that the daily and monthly gyrations are nothing to fret over, that the price will recover and, in time, fetch new highs.
That advice has worked every time gold underwent any significant correction (except in late 2008, when one had to take a longer view than three months). Here's proof...
I've traded e-mails regularly with Brent Johnson ever since meeting him at an investor event I spoke at a couple years ago. He's the managing director of Baker Avenue Asset Management, a wealth management firm with over $700 million in assets. He forwarded some charts he'd prepared for his clients that put gold's September decline into perspective... They're a good visualization of my standing advice to worriers.
The following charts document corrections in the gold price of 8% or more – first measured with daily prices, then monthly, quarterly, and annually. See if this doesn't put things into perspective.
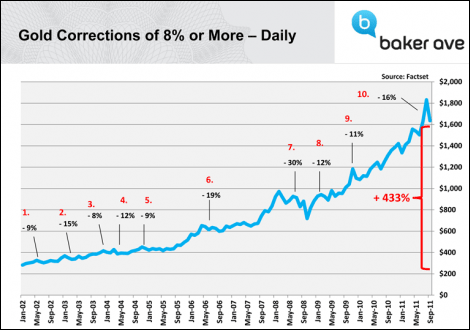 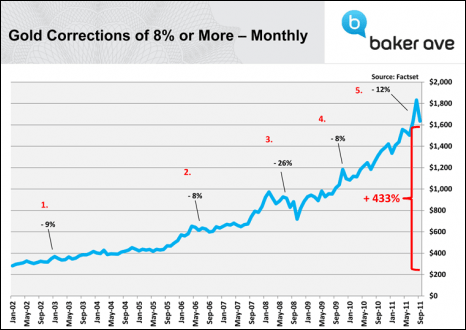 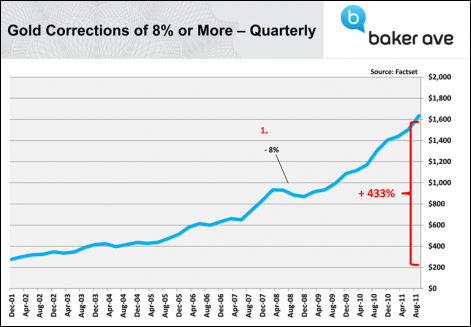 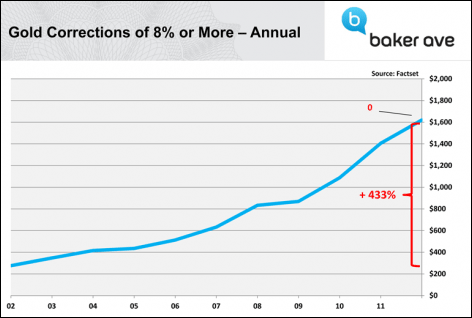 While the gold price has had plenty of big corrections since late 2001, they're not so concerning when viewed beyond a day-to-day basis. In fact, if one resists checking the gold price except once a quarter, one might wonder what all the fuss with price declines is about.
You'll also notice that the September decline, when measured monthly, was our second-biggest in the current bull market (and third when calculated daily). This suggests to me that unless we have another 2008-style meltdown in all markets, the low for this correction is in.
That's not to say the price couldn't fall from current levels, of course, nor that the market couldn't get more volatile. It's simply a reminder that when viewed on any long-term basis, corrections are nothing but one step down before the next two steps up. It tells us to keep the big picture in mind.
It also implies that pullbacks represent buying opportunities. It demonstrates that one could buy any 8% drop with a high degree of confidence. Keep that in mind the next time gold pulls back.
Until the fundamental factors driving gold shift dramatically – something that would require most of them to completely reverse direction – I suggest deleting any worries about price fluctuations from your psyche.
And if you're still a tad uneasy about today's gold price, well, let's talk next February.
Good investing,
Jeff Clark, Casey Research
Further Reading:
What do you suppose is the biggest risk we face? Another 2008-style selloff? Gold stocks never breaking out of their funk? Maybe a depression that slams our standard of living? Though those things are possible, Jeff doesn't see them as your greatest threat.
"One bullish factor for gold escapes many gold watchers and certainly the mainstream media. And I'm convinced once this sleeping giant wakes, it could ignite the gold market like nothing we've ever seen..."
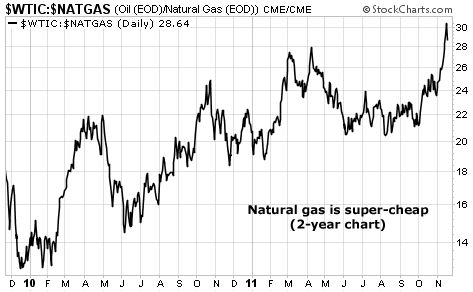
Market NotesCHART OF THE WEEK: AMERICA'S NEW FUEL Natural gas is cheap... and getting cheaper. That's the idea behind this week's chart.
Oil's "clean cousin" natural gas is a jack of many trades. It's used as a building block to make chemicals, fertilizers, and plastics. It's also used to fire power plants and heat homes and factories. And it's becoming widely used as a motor fuel.
Expect all of these uses to increase. In just the past 10 years, America has gone from expecting to import natural gas to boasting the world's largest supplies. That's thanks to advances in drilling technology, which are allowing natural gas producers to find more and more of the stuff every day. The U.S. is now "the Saudi Arabia of natural gas," which has resulted in a glut... and much lower gas prices.
One way to view this glut is through the oil/gas ratio. This ratio compares the price of the energy cousins against each other. Years ago, this ratio drifted between six and 10. Sometimes, the ratio would even spike to 14, which indicated really cheap natural gas. But just recently, the ratio spiked to 30. Gas is ridiculously cheap, which is why we're going to start using a lot more in America.
 |
Stat of the week
20.7%
Gain in the price of gold so far this year. It's on track to close its 11th-straight year of gains.
In The Daily Crux
Recent Articles
|

