| Home | About Us | Resources | Archive | Free Reports | Market Window |
Emerging Market Stocks: Why I’m Cautious NowBy
Tuesday, April 25, 2006
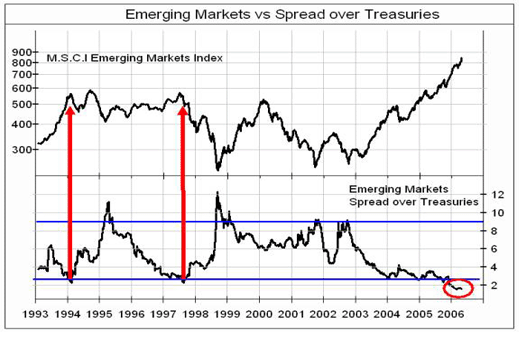
“Brazil is the next great country... and it always will be...” This was the advice I was given when I started working at a firm specializing in international stocks and bonds back in 1993. The basic idea was harsh: Brazil, as a country, has never made it to “the big leagues” and it never will... The further implication is just when things appear most attractive in emerging markets, they’re often the most dangerous. In hindsight, that advice about Brazil was good advice for a long time... In 2003, ten years after I was told “Brazil is the next great country... and it always will be,” Brazilian stocks were unchanged in U.S. dollar terms (according to the MSCI Brazil Index). Brazilian stocks were dead money for ten years. But since 2003, Brazilian stocks have caught fire – they’re literally up over 200%. Everyone loves emerging market stocks right now, and Brazilian stocks in particular. So is the old saying about Brazil no longer true? I don’t know about Brazil , but the old wisdom - that just when things appear good in emerging markets is when they’re actually the most dangerous - definitely appears to be true right now. Today, I’ll show you what I use as my “too good to be true” indicator. But first I’ll show you the results... My indicator said things appeared too good in emerging markets at the beginning of 1994. A couple years later, you’d have been down by 20%. (Even 10 years later, you STILL would have been down.) Once again, in late 1997, my indicator said things looked too good to be true. One year later, emerging market stocks lost half their value. It’s been a long time since those days, but my indicator is now at its most extreme level in recorded history. Take a look at this chart. The bottom blue line is the line to look at. Whenever the black line crosses below that blue line, it’s time to start getting cautious.
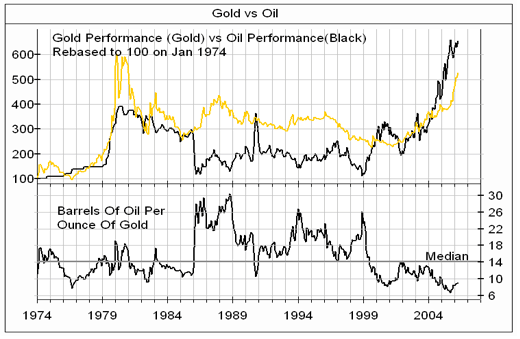
The top portion of this chart is the MSCI Emerging Markets Stock Index in U.S. dollar terms. The bottom line is the “spread over Treasuries” of emerging markets bonds. This is the key... This “spread” tells me how aggressive big investors have gotten when it comes to emerging markets. With the spread over U.S. Treasury bonds at less than 2 percentage points, it means that countries like Russia can borrow at an interest rate that’s just two percentage points higher than the U.S. I don’t know about you, but I’d need to get paid a lot more than 2 points over U.S. interest rates to put my money into Russia. It wasn’t too long ago that Russia defaulted on its debts. There is a possibility that if you send your money to Russia, you may never see it again. Big investors are excited about emerging markets. But I’ve seen this movie many times before... Just when things look the most attractive is often when they’re the most risky. The trend is still up in emerging market stocks. I don’t want to stand in front of that freight train, so it’s not time to get out or bet against them just yet. But heed the warning. The chart tells us that once we get to levels like these, it’s time to get cautious. Make sure you know where you’ll get out of your emerging market stocks (with trailing stops) when the music stops. Because the music will stop... sometime in the not-so-distant future. Good investing, Steve Market NotesBUY GOLD, SHORT OIL? Gold is getting extremely cheap. Now… before you point out that gold has gained nearly 50% in the past year… before you decide your editors have lost their minds, let’s look at an interesting chart… The chart is gold vs. oil. Since oil and gold respond to wars, inflation, and global economics the same way, the two commodities tend to move in the same direction. Their median ratio over the past 30 years is 14 barrels of oil buys one ounce of gold. Due to oil’s 200% rise over the past four years, that ratio is now out of whack. Gold is dirt cheap in relation to oil: Nowadays, it only takes about 8 barrels of oil to buy one ounce of gold, versus a historical median of about 14. (In the nineties, it took 15 – 20 barrels of oil to buy one ounce of gold.). We wouldn’t bet the farm on a ratio like this. But we will bet that gold will rebound from its depressed levels against oil... and the current price of gold will look like a bargain a few years from now. |
Recent Articles
|


