
Not a subscriber? Click here to learn
more.
|
| Home | About Us | Resources | Archive | Free Reports | Market Window |
|
Editor's note: We're continuing our series from New York Times bestselling author Bill Bonner. All week, we're featuring excerpts from his latest book... Yesterday, he explained how government "quants" manipulate the inflation number. Today, he'll show you how that and other "tortured" numbers can take a poor man and make him "rich."
How to Win the "War on Poverty" Without Spending an Extra CentBy
Wednesday, July 30, 2014
The problem with the "inflation" number runs deeper than just statistical legerdemain. It concerns the definition of inflation itself.
Does the word refer only to the rise in consumer prices? Or to the increase in the supply of money? The distinction has huge consequences.
In the years following the '08–'09 crisis, it was the absence of the former that permitted central banks to add so much to the latter. In other words, their measurement of "inflation" not only had far-ranging consequences for bondholders, investors, retirees, and so forth, it also created a huge distortion in the entire planet's monetary system.
As long as consumer price inflation didn't manifest itself in a disagreeable way, central bankers felt they could create as much agreeable monetary inflation as they wanted.
Here again, their engineering was a marvel of contradictions and false pretenses.
The real rate of consumer price increases in the U.S. is unknowable. But it is not unimportant. People place their bets. Depending on the Consumer Price Index (CPI) number, some people win, some lose. And the outfit that has the biggest bet of all is the very same as the outfit that keeps score.
The government wants the lowest CPI possible. A low CPI helps keep revenues up and costs down. Social Security payments, for example, are adjusted to CPI increases. So are the Fed's inflation-protected bonds, and taxes, too.
Every investor has an idea of how much he has made. But none knows for sure. Because, if you calculated inflation the way they did in 1980 (the system has been modified twice since then), you'd have an inflation rate today of about 9%, not 2%. And if that were true, the stock market gains from 1980 to 2012 disappear.
Meanwhile, the authorities keep inventing new ways to torture the numbers.
An article appeared in the press on October 4, 2012 called "Health care as 'income' for the poor." The New York Times reported that the Congressional Budget Office (CBO) had decided to include government's health care spending, dollar for dollar, as income to American families. In the blink of an eye, the numbers boys at the CBO increased the household income of the bottom fifth of the population by $4,600 per household, thus lifting hundreds of thousands above the poverty line.
The government does indeed spend nearly $8,000 on the average Medicaid beneficiary per year. As for the average Medicare recipient, the total rises to $12,000. So, the statisticians seem to be on solid ground in terms of adding this money to the "income" of the people who receive it.
The NYT is much too earnest a journal to mention it, but this opens up vast new possibilities for the number crunchers.
Do the poor not also receive their share of other spending? Their children are educated, almost entirely at the expense of the government. Take the median number of children. Take the cost of a private school education. Add that to the typical low-income household.
Presto! They're now a middle-income household.
No kidding. Do the math. Or make it easier. Take education spending – $809 billion. Add it to household income. You just increased the average household income of the lowest fifth of the population by $7,000.
And what about security? Don't American households benefit from U.S. "security" spending? If they don't, why do we spend the money? The feds spend about $800 billion on "security." And if you added in all the crackpot spending justified in the name of security – such as building a U.S. embassy in Baghdad that can withstand a nuclear attack – the total is closer to $1.2 trillion. Divide that by 114 million households.
Whamo! Add another $11,000. Now we're talking!
In fact, what is the entire U.S. federal budget – not to mention state and local budgets – if not a benefit to the citizens, residents, and illegal immigrants of the United States of America? So, take the whole damned budget and divide it up. And now we have the poorest people in America with household incomes of about $55,000.
Voila, we have won the war on poverty without firing a shot.
This is an extreme example, of course. Or is it? All we have done is taken the logic behind adding healthcare to household income to its logical end. Extreme or not, this is the nature of modern economics.
Most economists today think they work in a branch of hard science, not a branch of philosophy. They think they face bounded problems that can be reduced to numbers and then manipulated and solved.
But there is no science in it. There are no reproducible results. The initial conditions were never controllable. And you can never disprove a hypothesis. As a result, the "theories" are all claptrap and the numbers are all meaningless. Just ask the bottom 20% of American households who were told they were no longer poor – or less poor – with a few clicks of an adding machine.
– Adapted from Hormegeddon: How Too Much of a Good Thing Leads To Disaster. Copyright © 2014 by Bill Bonner.
Further Reading:
"When it comes to the Fed," Porter Stansberry writes, "people assume that the experts are handling things. They forget that the Fed is a cartel, and the purpose of forming a cartel is to protect its members." Learn how the Fed steals from you and gives to the very rich here.
"The story of One Chase Plaza is the story of how America was sold to its bankers," writes Porter. "It's the story of how inflation plundered our wages. It's the story of how credit, rather than savings, came to dominate our economy and transform our way of life." Read it here.
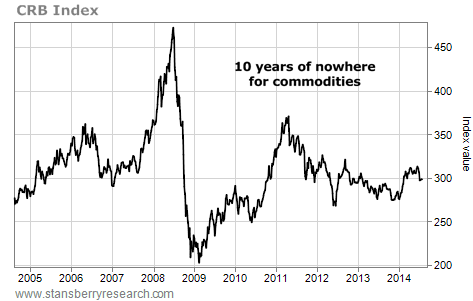
Market NotesTEN YEARS LATER... STILL NO RETURNS Today's chart shows it has been a tough 10 years for commodity bulls...
Over the past decade, many folks have predicted a major climb in commodity prices. They often say commodity prices will soar due to the debasement of the U.S. dollar. While that may happen in the future, it certainly hasn't happened over the past decade. For proof, we consult the "CRB Index"...
The CRB is one of the most widely used gauges of commodity prices. It tracks the price of basic raw materials, like copper, oil, corn, natural gas, gold, sugar, cotton, and nickel.
Below is a 10-year chart of the CRB. In 2005, the CRB sat around 300. Since then, it has "boomed" and "busted" several times. All this volatility has produced no price gains, however. As of this week's trading, the CRB sits around 300. It has been 10 years of no returns in the broad commodity market.
 |

Recent Articles
|


