
Not a subscriber? Click here to learn
more.
|
| Home | About Us | Resources | Archive | Free Reports | Market Window |
An Unusual Set-Up in This Simple, Market-Beating StrategyBy
Friday, January 9, 2015
The education of new investors often follows similar paths...
New investors get interested in the stock market and plan to get rich quick. They think it's just a matter of time before they find some small, unheard-of company that will grow 100 times over, making them rich.
Before long, the investors realize that investing in small-growth stocks is harder than it looks. Yes, occasionally a tiny stock blossoms into a big winner. But it's usually not enough to offset all the other duds. They learn that smart investors buy established quality companies and hold them for extended periods.
And yet... small-cap stocks as a group actually do outperform large caps consistently over time.
That's an undeniable fact. Historically, putting your money in small-cap stocks has given you a better return over time. Overall, these are growing companies. Wall Street analysts don't pay much attention to them, so there's a better chance they are undervalued.
But you have to do it right. You can't try to cherry-pick the winners. You need a diversified basket of small-cap stocks...
Economists Eugene Fama and Kenneth French provide a quality data set to show this.
If you created an annual portfolio of the 30% of stocks that are the smallest on the market and compare it with the largest 30%, the small stocks make a lot more money. One dollar invested in 1990 in small caps would be worth $30.52 today. A dollar invested in large caps would have grown to $12.05.
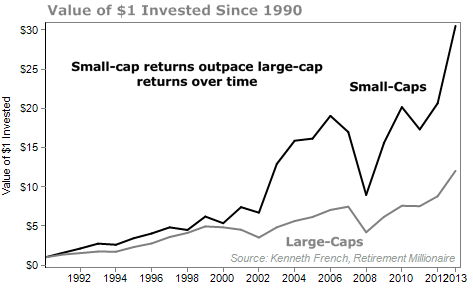 Taking a longer view, $1 invested in 1926 would be worth $5,203.43 in large caps... but $236,497.39 in small caps.
The typical knock on small-cap stocks is that while they do provide higher returns, their volatility makes them scary investments.
That's only true if you have the wrong time frame.
As you move your investment horizon out, you can become more certain about how your stocks will perform.
Think about it this way... If you buy a stock today, you can't make a reliable prediction about what your returns will be a week from now.
And it's hard to predict what your return will be one year from now. While stocks typically return 6% to 7% per year, the results will fluctuate. You don't know if this year will be a good year or bad year.
But as you stack up the years, the returns will get closer to the expected average. You may have one, two, or three bad years in a row. But over 10 years, things average out.
A study by financial research firm Morningstar suggests that once your holding period extends past 15 years, small caps provide a higher return with less risk than large caps.
For a long-term buy-and-hold investor, small caps make sense.
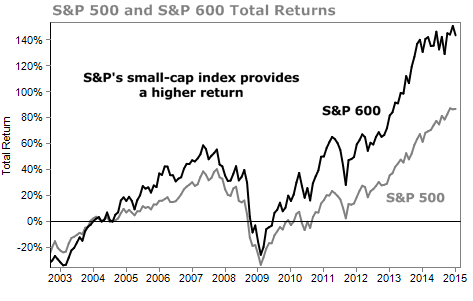
As you may know, the S&P 500 Index is designed to be a representative sample of the stocks of the 500 largest companies that comprise the bulk of our economy.
But the company that tracks the index, credit-ratings firm Standard and Poor's (S&P), also tracks the S&P 600. This is a collection of 600 small-cap companies, ranging in valuations from $162 million to $3.8 billion.
While these are small caps, they aren't wild speculations. Standard and Poor's maintains criteria to ensure that each stock is liquid and has a degree of financial stability.
The index includes companies you may know, such as shoe maker Skechers (SKX), brewer Boston Beer (SAM), and restaurant chain Cracker Barrel (CBRL).
The stocks in the index exhibit the growth we're looking for. Analysts expect that earnings per share for the S&P 500 will grow 12.8% this year. But the stocks in the S&P 600 are expected to grow earnings 35%.
Just like Fama and French's data, when you compare the returns of the S&P 600 and S&P 500, including dividends, the small-cap stocks give an extra 1.7% return annually.
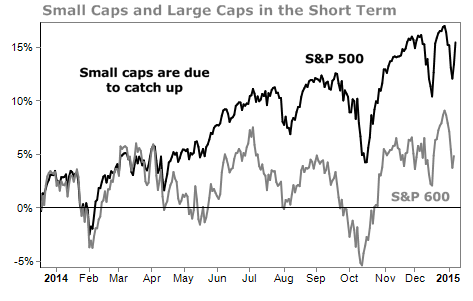
 Over the course of the last year, however, the small-cap index has underperformed larger stocks...
This suggests it's a particularly good time to buy them. Small-cap stocks are due to outperform in the near future to "catch up" to large-cap stocks.
 The S&P 600 is just an index though. Standard and Poor's maintains it simply as a reference. But you can invest in funds designed to follow the same methodology and deliver the same returns.
If you've been putting off investing, this is the place to start. A safe, diversified, small-cap fund should outperform stocks. It's the perfect buy-and-hold for those with a long timeframe who are unsatisfied with the low returns available in savings accounts or CDs.
And if you've got a lot of large-cap holdings, a good small-cap fund can provide a much needed boost of growth to your holdings. Plus, given the current state of the economy, it looks like a good time to buy.
Here's to our health, wealth, and a great retirement,
Dr. David Eifrig
Further Reading:
Doc says another great asset to own today is timber... "This overlooked commodity has continued to provide my Income Intelligence subscribers with growth AND yield over the past few months… even with a surging dollar," he writes. Find out why right here.
Last week, Editor in Chief Brian Hunt revealed what he calls "the butterfly effect of spent money." It's a "powerful, hidden force that is released when you save money instead of spending it." Get all the details here.
Market NotesTHE CROWD WAS WRONG ABOUT INTEREST RATES Today's chart is a reminder... trading interest rates can drive you to drink...
Read investment newsletters for more than a week, and you're bound to come across an interest rate prediction. Folks love to predict where interest rates are going. And they almost always predict that they'll go higher.
Real estate agents always predict higher rates and remind you to "lock in a low rate now." Speculators study government reports to guess where interest rates are going.
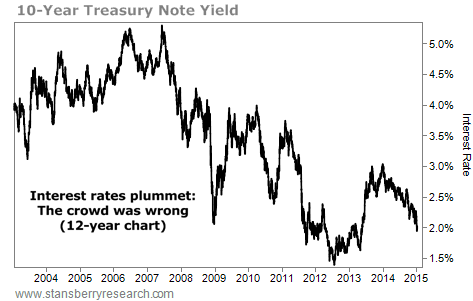
We track interest rates with the benchmark 10-year Treasury note. It's the most widely followed interest rate in the world. It's commonly cited when folks talk about the interest rate Uncle Sam pays when borrowing money. Below is a 12-year chart of this rate. As you can see, back in 2004, this rate was around 4% (40 on the chart). Today, after years of declining, the rate is less than 2%. Years and years of losses and being wrong. Interest rates are driving the crowd to drink.
 |
Recent Articles
|


