
Not a subscriber? Click here to learn
more.
|
| Home | About Us | Resources | Archive | Free Reports | Market Window |
|
Steve's note: My colleague Greg Diamond used to manage portfolios worth millions of dollars. Then last year, he joined our company... And right away, he started sharing his insights and methods with my young team.
That's how I know you're in good hands. You see, Greg has mastered a unique style of trading. In this piece, he shares a little about how it works... And he explains why we should prepare for big opportunities over the next few years.
We're Nearing a Historic Moment for the MarketsBy
Wednesday, April 18, 2018
I couldn't care less about a stock's fundamentals.
Now, don't get me wrong... If you're buying a stock and planning to hold it for years, fundamentals are critical. But in the short term, fundamentals don't matter.
Instead, what I focus on is technical analysis. This kind of trading shows you what's happening in the markets right now – the patterns of buying and selling that are taking place in the moment.
In my experience, too many investors spend their time wondering why the market is moving instead of focusing on how to profit from it.
Right now, the patterns I'm seeing are telling me that something big is coming. We're nearing a huge inflection point in the markets... And I want you to take advantage of it.
Some people think technical analysis is all about chart reading. But it's much more advanced than that. The biggest component of technical trading is about behavioral finance.
Human behavior – what investors are doing in the markets – never changes. And if you study history and obsess over patterns, you'll see that behavior in the markets goes in cycles.
In other words, what has happened before will typically happen again.
This is a technical concept called "time cycles." It comes from legendary trader W.D. Gann, a market theorist from the early 20th century. He found that markets move in symmetrical cycles. If you can understand them, you're better able to predict tops and bottoms in the market.
For example, as I recently showed my readers, the stock market appears to reach an important turning point every nine years...
Now, over the past nine years, we've seen a historic bull market. It's a safe bet that we're approaching an important moment... a major turning point for investors. Based on history, I knew at the very least that last month was going to be a seriously volatile period for stocks. Sure enough, over a period of 10 trading days in March, the S&P 500 Index fell more than 7% – a huge move for a major market index. So what's coming next? How long will all this volatility continue? Time cycles may provide an answer... In September, I noticed the market forming an interesting pattern – one that I'd seen before. You see, over a 26-month period from March 2009 to May 2011, the Dow Jones Transportation Average more than doubled. And it looked like something remarkably similar was happening again... 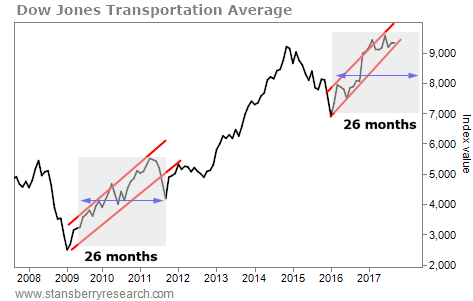 The last time we saw a 26-month run like this, the market stalled out before continuing higher. I told my readers that based on history, a similar correction could happen again in the spring. And that's just about what happened... The markets fell 10% or more in early February.
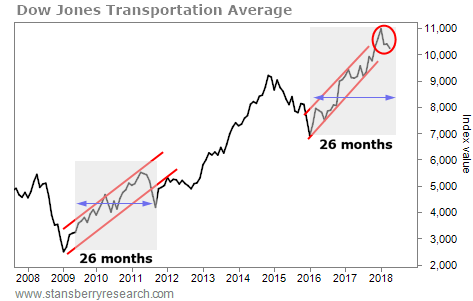 Time cycles were able to tell us a correction was coming. Not only that, but we can also see from 2011 that the recent correction could be another powerful catalyst for another leg higher – in today's case, what my colleague Steve Sjuggerud calls the "Melt Up."
How long before this rally could start? We can't know for certain. But when the first cycle top concluded in 2011, the period of volatility lasted three to five months.
Should that be the case this time around – and I believe it will – that will take us right into May.
Looking beyond that point... last year gave us the lowest volatility we've seen in years. I think that we are at an incredible inflection point in the markets that could potentially flip that on its head.
Technical analysis shows that when we reach these key moments in the market, we tend to see extreme moves in one direction or the other. That volatility gives us a chance to hit some home runs.
I believe we'll see extraordinary trading opportunities in the next two to three years. That's why we need to take advantage of this now – while this period lasts.
The markets will soon reach a critical point. But I'm not so concerned with whether they will go up or down. I'm concerned with the what and when... meaning what prices are going to do and when. I'm focused on how to trade what the market gives us.
That's how we'll make big profits... by hitting singles while we wait for our chance at a home run.
Good investing,
Greg Diamond
Further Reading:
"You shouldn't cheerlead the market ever higher," Dave Eifrig says. In this essay, he explains why... And he shares another technique that can help you capture solid gains when volatility is high. Read more here: Exactly How You Should Trade the Next Market Correction.
Steve also started calling for a short-term correction back in October. "When this market goes down – and it will – that move will scare people," he writes. "I don't want you to be scared by it. Instead, I want you to take advantage of it..." Learn more here: Money Flooded Into Stocks Last Week – Here's What to Do.
Market NotesTHIS NICHE RETAILER IS EMBRACING THE E-COMMERCE TREND Today, we look at another clothing company that's adapting to new shopping trends...
Even with the bull market in full swing, the "death of retail" caused 26 major retail bankruptcies last year. Some traditional retailers – like Burlington Stores (BURL) – have rebranded to gain a competitive edge. Others have pivoted into the online-sales market...
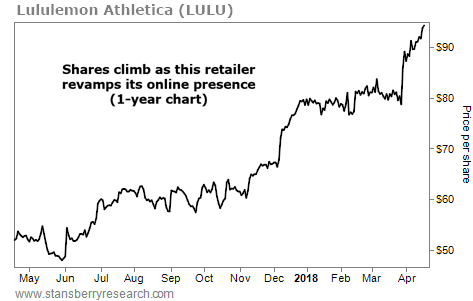
We're talking about "yoga inspired" apparel maker Lululemon Athletica (LULU). To capture more online sales, the $13 billion retailer revamped its website recently. Its efforts are paying off. Lululemon's latest e-commerce revenue jumped an incredible 42% from the same quarter last year... And its e-mail subscribers doubled in 2017. Next, Lululemon plans to let customers pick up their online orders in more of its physical stores. And more of its locations are offering ship-from-store services.
As you can see, these changes are fueling a solid uptrend... LULU shares are up 80% over the past year, and they recently hit a new all-time high. It's more proof that as online shopping thrives, a strong web-sales platform can help some retailers to stay competitive...
 |

Recent Articles
|


