
Not a subscriber? Click here to learn
more.
|
| Home | About Us | Resources | Archive | Free Reports | Market Window |
This Contrary Indicator Says Stocks Have BottomedBy
Friday, November 23, 2012
Over the last decade, this idea has been "a perfect contrary indicator," my friend Jason Goepfert explained on Monday.
Jason runs the excellent SentimenTrader website – my go-to site for all things "sentiment."
When this indicator has signaled in the past, it's delivered incredible returns in the next two months. (There's only been one exception.) And it just signaled again.
Before I tell you about its specific results, let me show you why it works...
To me, investor sentiment is the most useful way of determining when a market will bottom. Measuring sentiment is more art than science – but Jason has made it as scientific as possible.
Investor sentiment data is most useful – by far – when it is at extremes. The basic idea is this:
When EVERYONE is scared and has sold, it's almost time to buy.
Sentiment indicators are "contrary" indicators because you're buying when fear is at its peak. And right now, according to this particular indicator, one important group of investors is extremely scared... newsletter writers!
It turns out newsletter writers are good contrary indicators. When they are all telling their readers to sell, it's almost time to buy.
Importantly, according to one of Jason's indicators, newsletter writers are really scared. It's time to buy.
I can't divulge the specifics of the indicator (it wouldn't be fair to Jason's paying subscribers). But over the last 10 years, it's had a nearly perfect track record, with 2008 as the only exception. As Jason explained on his website on November 19...
So far, Jason's indicator has been exactly right... After falling for six-straight weeks, the Nasdaq stock index is up again, right on cue, following this latest signal.
I published the latest issue of my True Wealth newsletter last Friday. I didn't have the benefit of this indicator to go on... but I fully agree with Jason. Here's what I wrote:
I stand behind my analysis... And Jason's indicator is one more confirmation that this correction in stocks is over.
Trade accordingly...
Good investing,
Steve
P.S. "Since the 2009 market bottom," Jason explains, "the indicator has reached this extreme three times, and all three were perfect inflection points." For more on Jason's work – and the other important indicators he uses to track sentiment – visit his site at www.SentimenTrader.com. (We get no compensation for mentioning SentimenTrader.)
Further Reading:
When Jason Goepfert talks, we listen…
In September, with the S&P 500 up 16% on the year, Steve checked in with Jason. His data tipped Steve off to a 90-day pause in the Bernanke Asset Bubble. Two months later, the market is down nearly 5%. Get the full story here.
And back in 2010, Jason's data showed that based on history, there was a 98% chance stocks would be higher in 90 days. Three months later, stocks were up 11%.
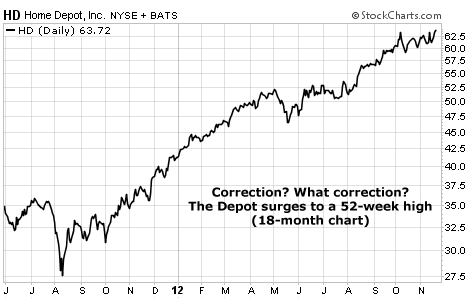
Market NotesAN AMAZING HOME IMPROVEMENT CHART The stock market suffered a panic selloff after the election... but you wouldn't know it if you were just paying attention to Home Depot.
Regular readers know "the Depot" is one of our favorite "real world indicators." Home Depot is the largest home improvement chain in the U.S. Its fortunes rise and fall with America's ability to spend money on kitchen upgrades, refinished bathrooms, and home additions. Thus, its share price trends tell us a lot about the state of the economy.
As you can see from the chart below, the state of the economy is improving. Home Depot has surged since late 2011. The stock is so strong it barely budged during the post-election selloff. And just this week, it struck a new 52-week high. In other words, the housing market is doing much better than pessimists would have you believe.
Home Depot isn't alone in its success. Other housing-related plays like Lowe's (home improvement), Sherwin-Williams (paint), Whirlpool (appliances), and American Woodmark (cabinets) also hit new 52-week highs last week. The housing market continues to impress...
– Brian Hunt
 |
In The Daily Crux
Recent Articles
|


