
Not a subscriber? Click here to learn
more.
|
| Home | About Us | Resources | Archive | Free Reports | Market Window |
My Simple Approach to Sizing up Any InvestmentBy
Thursday, July 25, 2013
People often ask me, "Steve, how do you know how to size up so many different types of investments?"
On the surface, that's a difficult task. After all, what do stocks in Hong Kong have to do with U.S. real estate, Japanese bonds, or gold-mining stocks?
"Not much," is probably the correct answer. But there is a simple way to put all of these investments (and almost any investment) on the same playing field.
Anyone can understand this approach. And right now, it shows a clear winner in the global investing landscape. Let me explain...
It's simple. Regardless of whether it's stocks, bonds, real estate, or something more exotic, I look at all investments through the same lens...
I want to know how long it will take me to get my initial investment out of it.
This is a great way to equalize investments... and size them up with the same measuring tool.
Let's look at a couple examples...
Last year, I bought a property (with some partners) for less than $1 million. In 2008, that property had been under contract for $14 million. Within a month, we got an offer for twice what we paid for it. (We actually didn't take the offer... We think the property is worth more than that.)
It was risky, with no income potential, but I thought it could be worth double what we paid in 12 months. (The offer we got was proof of that.)
I also think this way with income... For example, how many years of rent (after expenses) will it take to pay off the purchase price of a house? Or how many years will it take to double your money in the bank at current interest rates?
In other words, how long will it take until you're riding on "the house's money"? It's an easy yardstick... an easy equalizer.
I think this way when I'm sizing up companies to invest in, too. In simple terms, I think of it as if I was the only buyer of the business.
How many years will it take for me to earn back what I paid for the business? After that, all the income is free money...
If you're collecting rent from a property you own, it might take decades... And at current interest rates, it would take over 100 years to double your money at the bank.
The overall stock market trades at a price-to-earnings (P/E) ratio of 15 today. That means it would take you roughly 15 years to get all your money out, assuming you could buy the entire market as though it were a single business and earnings never grew.
The table below shows a few major assets classes... and how long it would take to get our money out of each one. Take a look...
Of course, this isn't a perfect approach. The less risky an investment, the longer it should take to get your money back. But it's a simple way to look at several very different investments and get a feel for how they stack up against each other. In my opinion, even factoring in risk, stocks offer the best value today...
As I wrote earlier this week in DailyWealth, I believe the S&P 500 could rise another 1,000 points over the next few years. And at values like these, we could see similar gains around the globe.
I suggest you position your portfolio accordingly.
Good investing,
Steve
Further Reading:
Earlier this year, Steve revealed the incredible forces "working together to push stock prices higher" than anyone believes. "This isn't just hopeful thinking on my part," he writes. "It's backed up by a mountain of data and experience from my lifetime of investing."
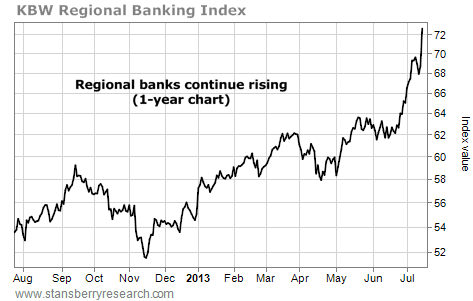
Market NotesIT'S A BULL MARKET IN REGIONAL BANKS The KBW Index is still heading higher... and it's still a bull market in regional banks.
Back in June, we noted an important upside breakout for the KBW Regional Bank Index, a widely followed gauge of regional banking firms. We mentioned how these firms aren't the "too big to fail" banks, like Bank of America and Citigroup. Regional banks tend to practice a more boring kind of banking, rather than trade trillions of dollars' worth of financial derivatives. They benefit when their local regions enjoy good economic times and rising asset values.
Like most assets, regional banks were crushed in the 2008/2009 bear market. But after struggling for years, they are breaking out to the upside.
As you can see from the one-year chart below, the KBW Index jumped past the 64 level in June. And in just the past few weeks, it has added eight more points to reach a multiyear high. For now, it's a bull market in regional banks.
 |
In The Daily Crux
Recent Articles
|
|||||||||||||||||||||


