
Not a subscriber? Click here to learn
more.
|
| Home | About Us | Resources | Archive | Free Reports | Market Window |
Why the Stock Market Is STILL CheapBy
Friday, July 18, 2014
People think U.S. stocks are expensive...
Yes, they have gone up a lot... But according to our favorite measure of stock market value, stocks are NOT expensive.
It's a simple indicator, but it encompasses the important stuff. And right now, it's telling us you could make double-digit profits in stocks over the next 12 months...
When our in-house stock market value indicator is below 22, you make double-digit profits in stocks over the next 12 months.
And when it is above 22, you lose money in stocks over the next 12 months.
Specifically:
The chart below shows our value indicator at work. You can see just how extreme the peak in stocks was in 2000... and just how extreme the bust was in 2009. Importantly, you can see that we are nowhere near the "expensive" line today. Take a look...
 There are two inputs to our stock market value indicator... 1) company earnings, and 2) the economic situation.
For company earnings... we use a price-to-earnings (P/E) ratio for the market. The P/E ratio is the classic measure of value for a business. But there are brief periods where it can be an imperfect and incomplete measure of value. Our in-house indicator addresses those two things.
The P/E ratio can be imperfect as an indicator during recessions. It can jump dramatically – not because stock prices are high, but because the denominator – the "E" or earnings – goes low.
So we make a small correction to the P/E ratio when that happens. We come up with an "adjusted" P/E ratio for the market. This makes the stock market's P/E ratio much less imperfect.
The P/E ratio also doesn't fully take into account the economic situation. It's not perfect for an apples-to-apples comparison of one economic situation versus another.
Sometimes the stock market has all kinds of economic headwinds – whether it's high inflation, unemployment, or high interest rates. We saw all of these in the early 1980s.
Other times, stocks have an incredible economic tailwind – like in the early 2010s, when the Federal Reserve cut interest rates to zero with next to no inflation.
These are entirely different situations for stocks, but the classic P/E ratio doesn't distinguish between them. Our value indicator accounts for these times by using the short-term interest rate.
Surprisingly, the short-term interest rate encompasses an incredible amount of information about the current state of the economy. For example:
For our measure of the economic situation, we use the interest rate on three-month government debts (also called the 90-day Treasury-bill rate).
In short, our in-house value indicator is:
The adjusted P/E ratio + the short-term interest rate.
I'm not claiming this measure of value is a perfect one... It just offers a clearer way of assessing the current situation.
The message today is simple: stocks aren't as expensive as most people think!
Good investing,
Steve
Further Reading:
Earlier this week, Steve debunked the idea that a stock crash is imminent. "In the next few weeks and months, you will hear your friends and family (and your investment advisers) say that 'stocks have been going up for years – they have to correct at some point.'" But Steve says "there is no life expectancy in years for a bull market..." Learn more here: Get 'One Up' on Everyone Else in the Markets With This Knowledge.
Steve believes we have time to make money in stocks... But he says you still want to own precious metals over the long run. "And today is about as attractive an entry point as you will get on silver..." Get all the details here: The Best Opportunity of Your Life in Silver.
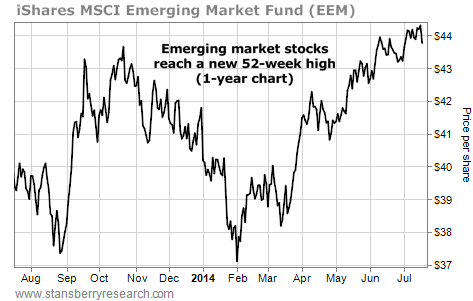
Market NotesEMERGING-MARKET STOCKS BREAK OUT TO NEW HIGHS Good news for owners of emerging-market stocks... EEM just broke out to a 52-week high.
DailyWealth highlighted the idea of owning emerging-market stocks many times in the past year. Emerging-market stocks were very out of favor... and very cheap.
An easy way to monitor emerging-market stocks is with the iShares Emerging Market Fund (EEM). It's a huge, widely traded fund that holds stocks from foreign markets like Russia, China, and Brazil. It's a "one click" way to take a diversified position in emerging markets.
Early this year, emerging-market stocks suffered a big selloff. But as you can see from the chart below, they've staged a big rebound. EEM just struck a new 52-week high. These stocks are still cheap... so expect more upside ahead.
 |

Recent Articles
|


