It might be the best buy signal you'll ever see for the gold-mining sector.
Since October, demand for gold coins and bars has soared so much that dealers can hardly find any to sell right now. If they can find it, the premium can run as high as 60% to 100% over the published spot price of gold.
When you can't buy gold... that's your signal to buy gold miners. And recently, it's been nearly impossible to buy gold, at least at anything resembling the alleged "spot" price.
One guy with a truly front row seat to this situation is Van Simmons of David Hall Rare Coins. Van is an expert in a lot of things. One of his specialties is rare, collectible coins. He's been in the business for decades, so he has a great feel for the precious-metals market. Over the last three months, I've spoken to him almost weekly.
According to Van, in October, dealers were actually marking up by 60%-100% bullion coins that commanded a 10%-15% premium just weeks prior.
By late November, the spot price of gold started to reflect that demand. The price rose 12% in November and 14% in December.
This is huge for the gold-mining industry. Gold miners had a brutal year in 2008... but the swelling demand for gold is doing wonders for their profit margins.
So now we have the best setup for profiting on gold mining in decades. The price of gold is up and going higher over the long term. Today, mining companies can make a lot of money mining gold because the cost of supplies, like fuel and explosives, is cheap.
The gold price rose from $799 per ounce in early December 2007 to $923 per ounce by the end of January 2008. It looked like a great time to buy gold miners. But if you jumped in then, you lost money. That happened even though the price of gold rose to more than $1,000 per ounce.
The reason is simple. Miners could sell their gold for a lot, but mining it cost them every penny they earned.
That situation is completely reversed today, and we stand to make a lot of money from it. Let me explain...
In 2007, gold miners' margins were terrible. It cost Newmont Mining (one of the largest gold miners in the world) $697 to produce an ounce of gold that it could only sell for $701. Similarly, Barrick Gold, another major gold miner, needs the gold price at $700 per ounce to make ends meet. But in 2007, gold averaged $697 per ounce.
The good news began for the sector in July 2008, when the costs of mining peaked. Since then, nearly all mining staples – oil, natural gas, iron, copper – fell by more than half. Meanwhile, the price of gold is up 25% this year. That tells me the earnings trend is now on our side.
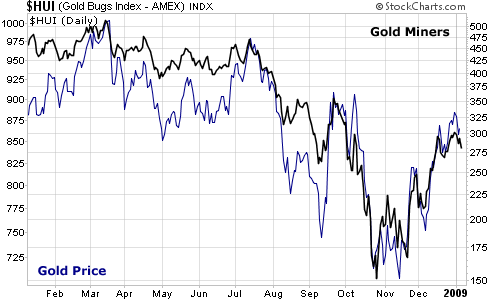
That is, in part, why gold-mining companies' stocks are rising while all the other commodity companies are falling. Below is a chart of the AMEX Gold Bug Index. The index tracks the value of the 15 largest gold producers. You can see that the index hit a low in October 2008 and has not looked back.
Many of the best gold-mining companies already trade for more than twice the recent low price. But after one of the sector's worst-ever bear markets, there's plenty of room to go.
To get started in gold miners, you can be conservative and buy a gold-miner mutual fund or ETF. Mutual funds worth checking out are the U.S. Global Gold and Precious Metals Fund (USERX) and the First Eagle Gold Fund (SGGDX).
However, not all gold-mining companies are worthy investments. A basket fund scoops up the bad with the good. While this uptrend will lift the whole sector, picking only the best producing miners and the best small exploration outfits will be much more profitable.
For producers, focus on a few simple criteria to pick the best companies. They must have low debt, low costs, and low risk. The companies that meet those criteria will outperform any sector fund.
Good investing,
Matt