Not a subscriber? Click here to learn
more.
|
| Home | About Us | Resources | Archive | Free Reports | Market Window |
|
The Weekend Edition is pulled from the daily Stansberry Digest. The Digest comes free with a subscription to any of our premium products.
Is Steve's 'Dow 50,000' Prediction Just a Clever Marketing Gimmick?By
Saturday, August 12, 2017
On Monday, the country's state-run media warned the U.S. it would "pay dearly" for imposing a new round of U.N. sanctions over the weekend.
On Tuesday, the Washington Post reported that the country may have already developed a small nuclear weapon that could reach the U.S. And President Trump had apparently heard enough. As Bloomberg reported...
It was unclear exactly what Trump had in mind. It also wasn't clear whether this was a planned statement or simply another off-the-cuff remark. Regardless, the markets took notice...
Traditional safe havens like U.S. Treasury bonds rallied this. Gold and silver – our favorite "chaos hedges" – were up sharply. And the Volatility Index (VIX) – the market's so-called "fear gauge" – surged higher.
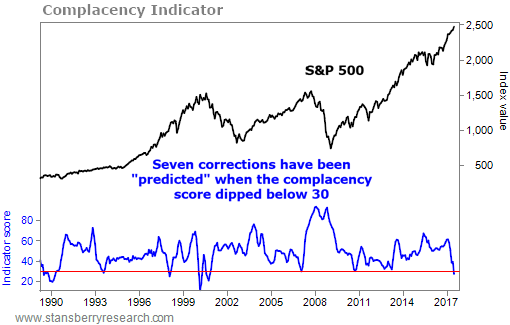
Or simply another speed bump on the way to new highs? Unfortunately, it's too soon to be certain. But regular readers know we believe it's simply a matter of time before a correction arrives. As Porter noted in the August 4 Digest...
Valuations are stretched, but not outrageous... investors are far from euphoric... and the market's "vital signs" remain healthy today.
And yet, we know many readers still aren't convinced.
We understand... Putting those arguments aside, this bull market is certainly getting "long in the tooth." It has already run for more than eight years – making it the second-longest bull market in history – and the major U.S. indexes are up hundreds of percent from their financial crisis lows.
How much longer can the rally reasonably go on? Is Steve Sjuggerud's "Dow 50,000" prediction even possible... or is it just a clever marketing gimmick?
If you're among the skeptics, the following chart is for you. It compares today's bull market with the longest bull market in history. And it suggests Steve's forecast isn't as far-fetched as it may have initially appeared...
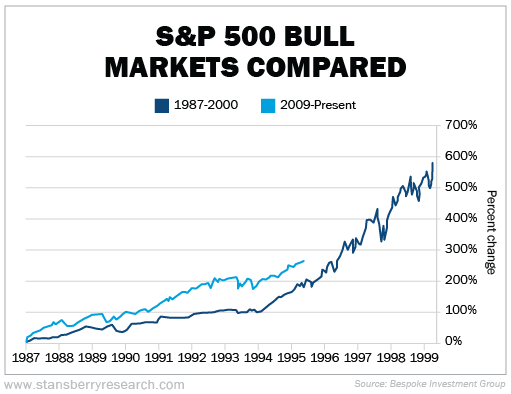 As you can see, despite its impressive run, the current bull market is dwarfed in both length and total return... From its post-crash low in December 1987 through the dot-com peak in March 2000, the S&P 500 Index rose nearly 600%. That's more than two times the return of this bull market so far. You can also see that the two bull markets have followed a remarkably similar trajectory so far. This suggests significant gains could remain ahead.
For example, when compared with the timeline of the 1987-2000 bull market, today would fall in late April 1996. As the folks at Bespoke Investment Group pointed out this week, warnings about "excesses" in the stock market were starting to appear at this time. But it was still seven more months before then-Fed Chairman Alan Greenspan's "irrational exuberance" speech in December 1996... and four more years before the bull market finally peaked.
Of course, we aren't saying the current bull market will continue to follow this path. There are no certainties in the market. But it shows that Steve's Dow 50,000 prediction – representing a 100%-plus rally from today's levels – isn't just possible... It has happened before. And again, this was just the blue-chip S&P 500... The tech-heavy Nasdaq Composite Index more than tripled over the same period.
In other words, if you still aren't positioned to take advantage of this possibility, you could miss out on the biggest gains of this entire bull market. Click here to learn more.
Regards,
|
Recent Articles
|