
Not a subscriber? Click here to learn
more.
|
| Home | About Us | Resources | Archive | Free Reports | Market Window |
This Will Cause the Next Stock Market PeakBy
Friday, December 15, 2017
We have a simple way to know when this boom will end...
It's an indicator that has predicted the end of every stock market boom over the past 30 years. I'm certain it will predict the end of this boom, too.
I will show you exactly what it is today. It's simple to follow. And it has been stunningly accurate.
This indicator tells an important story right now. It says the bull market can last for years... even into 2019 or 2020.
Let me explain...
If we want to know when the stock market peak will occur, we need to know when the next recession is on the way.
Recessions typically happen right after stock market peaks. So if you have an indicator that can predict the next recession, then you also have an indicator that can predict the next stock market peak.
Today's indicator does just that. It predicts recessions, well in advance.
The indicator is straightforward. It shows interest rates... specifically, the short-term interest rate that the Federal Reserve artificially changes (compared with most other interest rates, which are set by market prices and not controlled by anyone).
For the past eight years, the Fed has kept rates artificially low. And artificially low interest rates from the Fed have fueled the nearly 300% boom in stocks since the last bear market ended in March 2009.
But the Fed won't keep rates low forever. In fact, it has already started raising rates in recent years.
This, by itself, is not a bad thing. But if the trend continues, the outcome could be ugly.
You see, the folks at the Fed have caused the last three recessions – and the last three stock market peaks – by raising interest rates artificially higher than "normal."
Here's exactly what you need to know...
Each time the Federal Reserve has artificially pushed short-term interest rates ABOVE long-term interest rates (which puts us in an abnormal situation), the stock market has peaked, sending the economy into recession. Take a look:
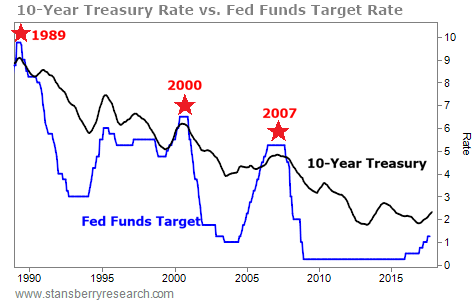 The last three times that short-term interest rates moved above 10-year Treasurys were in 1989, 2000, and 2007. Those were the last three recessions in the U.S. The rate hikes in 2000 and 2007 led to major stock market crashes. The Fed is responsible. It caused the recessions and the stock market busts by artificially raising interest rates too high.
So how close are we to this happening again?
The short answer is, not very close...
It could be as late as 2019 or even 2020 before the Fed's actions cause a recession and stock market bust.
Financial-news conglomerate Bloomberg regularly polls more than 40 economists about short-term interest rates... And based on estimates from those economists, short-term rates (controlled by the Fed) won't surpass long-term rates (controlled by the market) until 2019 or 2020.
Here's a look at the same chart with those economists' future estimates for short-term rates built in. (The estimate of the long-term rate is my own estimate.)
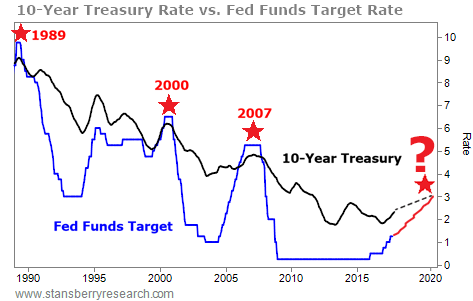 If the chart above is "about right," then it means some great things for us as investors. This chart has called every recession and major stock market peak over the past 30 years.
In short, if this idea proves right again, then the exact end of the bull market will happen when short-term interest rates rise above long-term interest rates. (That's the moment when we should dramatically change our investments to be more risk averse.)
We are not there yet. Based on this, the current bull market could go on for years.
It could be as late as 2019, or even 2020, before we see the peak.
Don't panic and sell just because stocks have had a historic run. We still have plenty of time to stay invested in U.S. stocks. Take advantage of it while you can!
Good investing,
Steve
Further Reading:
"You know what the end of a great bull market looks and feels like," Steve says. He explains how to tell when we're entering the final run-up in stocks, right here: A Major Change to My 'Melt Up' Script.
Early warning indicators can help us identify when the stock market is getting close to a top. Steve recently shared another signal to watch – one that could forecast the end of the Melt Up... well in advance. Learn more here.
Market NotesEXCESS DEBT IS A RECIPE FOR DISASTER Today, we see another debt-laden company in a downward spiral...
As Porter has said repeatedly, investors should avoid companies with high and mounting debt loads. Even with growing revenue, debt-saddled businesses have problems brewing beneath the surface. And when troubled companies can't pay off their debts... defaults follow.
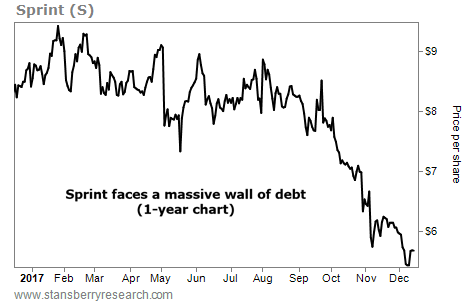
Sprint (S) is one of the largest wireless carriers in the U.S., but it carries a massive debt load of about $38 billion. That's nearly double what it had in 2010. Not only that, but Sprint faces a wall of debt – around $18 billion – coming due in the next five years as it struggles to compete with rivals like Verizon (VZ) and AT&T (T). Porter and his team recommended shorting Sprint in February in their Stansberry's Investment Advisory newsletter. So far, betting against this company has been the right move...
As you can see in the chart below, shares of Sprint have plunged 31% over the past year... recently hitting new 52-week lows. Readers who followed Porter's advice are sitting on 33% gains. Congratulations to Porter and his team on another great call!
 |

Recent Articles
|


