
Not a subscriber? Click here to learn
more.
|
| Home | About Us | Resources | Archive | Free Reports | Market Window |
All Right, Mr. 'Melt Up'... So When Does It End?By
Tuesday, January 16, 2018
In October 2015, I gave a speech in Las Vegas called "Welcome to the Melt Up."
"The great bull market in stocks that started in 2009 will ultimately end in a dot-com style Melt Up," I explained. Since then, I have hammered that theme home.
Nobody's cared – until lately.
Here in 2018, it seems, all the Wall Street experts are getting onboard with my "Melt Up" idea.
Investors are now asking me when it ends. Here's my take...
Long story short, we still have time. The ultimate market peak might not arrive until 2020. No kidding.
I like to give you simple explanations and simple answers, when I can. And I like to boil things down to one indicator for you to keep your eyes on, when I can.
It's a bit harder with this question, but it's still doable. Here's the answer:
Over the past 30 years, the Federal Reserve has caused the three major peaks in the stock market...
Specifically, the Fed artificially caused a situation called an "inverted yield curve." Once that happened, the market peaked more than 18 months later. Each time.
The reason is simple... You see, an inverted yield curve happens when short-term bonds yield more than long-term bonds. Normally, the reverse is true. Long-term lenders are taking on more risk, so long-term bonds tend to pay more in interest. When the opposite happens, it's a bad sign.
Investors will debate endlessly over the causes of the peaks... Valuation... debt... stupid politicians... But when you crunch the numbers, it turns out the inverted yield curve has predicted stock market peaks better than any of these things.
Take a look at the spread between the 10-year Treasury bond yield and the two-year Treasury bond yield. Going back to about 1985, each time the black line initially crossed below zero (causing an inverted yield curve), the stock market peaked more than 18 months later...
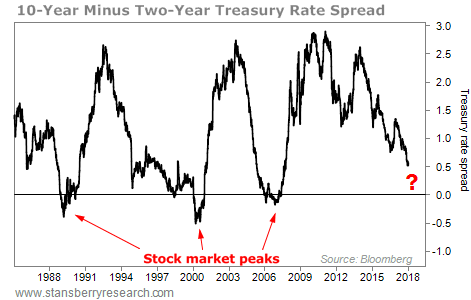 This is what happens when the Fed pushes short-term interest rates above long-term rates. For more than a decade, we've been "in the clear" on this indicator. But last week, the interest rate on two-year Treasury bonds shot up above 2% for the first time since the financial crisis. That caused the line in this chart to accelerate toward zero.
Once it hits zero, the clock starts...
However, the last three times the line has hit zero, it took more than 18 months for the stock market to peak.
If it takes another six months for the line to cross below zero, and then about 18 months for the market to peak, that puts us into the year 2020.
While the stock market peak could be pushed out to 2020 based on this one simple indicator, it doesn't mean things aren't risky...
For me, as soon as that line hits zero, I'll start making some changes... tightening my trailing stops... and preparing for the end of the bull market.
People have been poking me in the chest lately, saying, "All right, Mr. Melt Up... what's it gonna be now?"
It's hard to boil down a lot of moving parts into one signal to watch. This one indicator is the best I've got to help you plan for the end of the Melt Up...
Good investing,
Steve
Further Reading:
"We have a simple way to know when this boom will end," Steve says. Learn more about the Fed's manipulations and why this bull market could keep soaring for years, right here: This Will Cause the Next Stock Market Peak.
"Stocks are overly loved today to a degree we haven't seen in years," Steve writes. And as he explains, this could be the 1% of the time when that's a good thing... Read more here: Today's Record-High Optimism Doesn't Mean You Should Sell.
Market NotesNEW HIGHS OF NOTE LAST WEEK
Boeing (BA)... "offense" contractor
Northrop Grumman (NOC)... "offense" contractor
Royal Dutch Shell (RDS-A)... oil and gas supermajor
Chevron (CVX)... oil and gas supermajor
HollyFrontier (HFC)... oil refiner
Rio Tinto (RIO)... diversified mining
BHP Billiton (BHP)... diversified mining
Caterpillar (CAT)... construction equipment
Deere (DE)... lawnmowers and farm equipment
Stanley Black & Decker (SWK)... tools and storage
Sherwin-Williams (SHW)... paint
Lennar (LEN)... homebuilder
PulteGroup (PHM)... homebuilder
Bank of America (BAC)... America's "financial backbone"
JPMorgan Chase (JPM)... America's "financial backbone"
HSBC (HSBC)... financial services
Ally Financial (ALLY)... "branchless" bank
PayPal (PYPL)... society goes "cashless"
Global Payments (GPN)... digital payments
Microsoft (MSFT)... "digital utility"
Amazon (AMZN)... "FANG" stock
Netflix (NFLX)... "FANG" stock
Cisco (CSCO)... Internet "plumbing"
Texas Instruments (TXN)... semiconductors
Activision Blizzard (ATVI)... video games
Best Buy (BBY)... big-screen TVs, laptops, tablets
Adobe Systems (ADBE)... software
Baxter (BAX)... medical devices
Johnson & Johnson (JNJ)... health care giant
NEW LOWS OF NOTE LAST WEEK
Sears Holdings (SHLD)... dying retailer
Kimco Realty (KIM)... shopping centers
Dave & Buster's Entertainment (PLAY)... arcades
American Outdoor Brands (AOBC)... guns
GoPro (GPRO)... "cocktail party" stock
|
Recent Articles
|


