| Home | About Us | Resources | Archive | Free Reports | Market Window |
|
Steve's note: Today's essay comes from my friend and colleague Jeff Clark. Jeff is one of the world's top traders, and he's managed money for some of California's wealthiest people. For his unique take on making money in gold this year, read on... Read This Before You Buy GoldBy
Tuesday, January 27, 2009
It's easy to be bullish on gold.
After all, the dollar is a doomed currency. And so is the euro, the yen, the krone, the peso, and whatever they're using these days in places like Zimbabwe and Russia. Gold is the only real store of wealth and the only real time-tested method of exchange.
But you can't always make money buying gold when it's easy. Let me explain...
It was easy to be bullish on gold last March. The shiny yellow metal crossed over $1,000 per ounce and everyone wanted a piece of it. Individual investors were scurrying after it like squirrels for nuts. Newspapers were printing stories about the timeliness of gold investing. And Wall Street analysts were predicting $2,000 gold by the end of 2009.
Gold fell 15% in the next six weeks.
It was also easy to be bullish on gold last July. The dollar was falling. European banks were failing. And the U.S. financial system was entering crisis mode. Gold rallied all the way up to $980 per ounce by mid July, and investors rushed to buy it.
Over the next four months, gold fell to $710 per ounce – a decline of 28%.
So buying gold when it's easy to be bullish doesn't always create a profit in the short term. In fact, it often creates losses that shake the conviction of long-term gold bugs.
Gold bugs, however, need not be concerned. This year will be the year of precious metals. Gold, silver, platinum, palladium, etc. will all end the year higher than they started. Anyone who bought gold last March at $1,000 per ounce or last July at $980 per ounce will likely be sitting on profits by next December.
However, there's a better way to make money in gold. Rather than buying the metal when it's easy to, you have to buy gold when it's hard. Like last November...
In November, the world financial markets were caught in the downward spiral of a liquidity crisis. Investors sold stocks, corporate bonds, real estate, and precious metals to raise cash. Gold hit $710 per ounce, and the financial press was convinced it was going lower.
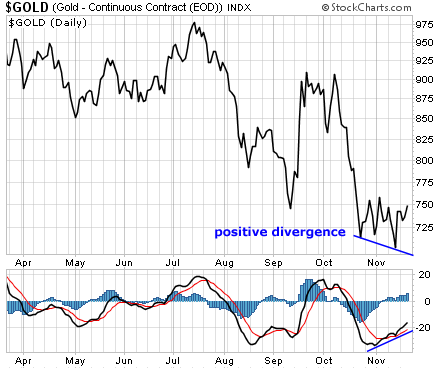
But if you were paying attention to just one little indicator, then you were buying gold last November rather than selling it. Take a look at this chart...
 This is a chart of the price of gold plotted along with its moving average convergence divergence (MACD) indicator. Even if you're not much of a technical analyst, this is easy to follow...
The MACD helps determine the strength or weakness behind a move on the chart. For example, if a chart is moving higher and the MACD is moving higher as well, the trend is strong and should continue. On the other hand, if a chart is moving higher but the MACD is trending lower, it's a warning sign the chart is likely to turn down.
On the chart above, you can see gold made a "lower low" between mid-October and mid-November. But the MACD was rising. This "positive divergence" was a clue the downtrend in the price of gold was weak and a reversal could happen at any time.
Sure enough, gold bottomed in mid-November and it's been a steady climb higher ever since. In fact, with the $50 gain in the yellow metal last Friday, gold is now at its highest price since last October.
And once again it seems easy to be bullish on gold. Investors love it. CNBC's talking heads are glowing over the price action. Analysts are almost guaranteeing higher prices.
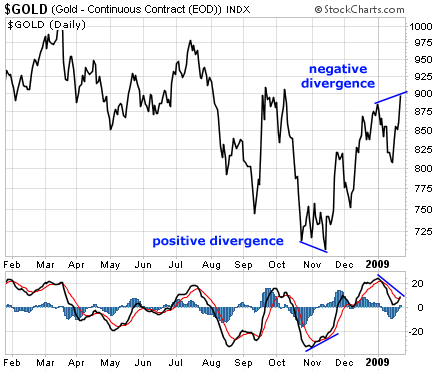
So let's take a look at an updated chart...
 You can see the recent rally in gold has occurred with a decline in the MACD. This "negative divergence" suggests the recent rally may be a bit too much too soon. We may see a pullback in the short term.
This isn't a sell signal. And I'm certainly not bearish on gold. In fact, I told my S&A Short Report subscribers to buy gold when it was bottoming back in November. And I told them to buy gold below $810 per ounce as recently as two weeks ago. We're not selling, and I'm convinced we will be sitting on much larger profits later this year.
What I'm suggesting, though, is if you don't own any gold yet, or you're looking to add a little more to what you already have, then you'll likely get a better price a few weeks from now.
Right now, it's easy to be bullish on gold. In fact, it's common sense. But if you want to make money in the metals market, then you have to wait until it's hard to be bullish.
By the look of the chart, you probably won't have to wait too long.
Best regards and good trading,
Jeff Clark
Market NotesSTILL LOOKING FOR THOSE TALL BLACK BARS...
About two weeks ago, we placed the stock market on "volume watch."
We expect the stock market to trade higher in 2009. But it's not going to climb because a few investors with $20,000 portfolios are feeling bullish. It's going higher only if pension- and mutual-fund managers put their huge, multibillion-dollar portfolios to work in the market. We track the "big money" by following trading volume in the popular S&P 500 exchange-traded fund (SPY). The bars at the bottom of our SPY chart mark the day's trading volume. Red bars are the volume on down days. Black bars are the volume on up days. The taller the bar, the greater the trading volume. As you can see from the "A" circle, volume was enormous during the October selloff. Volume tailed off during the holiday break (marked B). And even though folks are back at their trading desks, there's been little buying interest to push up stock prices (marked C). Sure... the market "should" rally soon. But it badly needs the big money to show up and push those black bars higher. |
In The Daily Crux
Recent Articles
|

