| Home | About Us | Resources | Archive | Free Reports | Market Window |
Five-Year Outlook in Stocks: You'll Lose MoneyBy
Wednesday, April 21, 2010
What are you getting for your money in stocks today?
Sure, the market is way up... and investors are excited... But what's the outlook over, say, five years?
To spare you the suspense, the outlook is not good...
Legendary investor Jeremy Grantham called the top in the markets in 2000 (like no one else). Then he backed up the truck and bought stocks at the very bottom in March 2009.
I crunched the numbers differently... and came to the same conclusion. Here's the simple way to see it:
Companies on the stock market are selling for over 22 times earnings today. Would you buy a business if it would take 22 years to get your money back?
Well, that's the way it is in the stock market right now... If you were buying a company today, it would take you over 20 years to make your investment back through company earnings (if earnings stayed flat).
As you might guess, that's not a good deal. History backs up this thought...
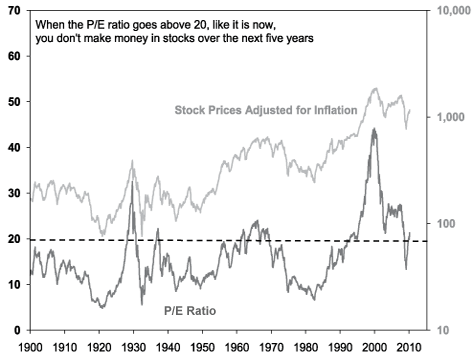
Since 1900, it's been a bad idea to buy stocks when they're trading at 20 times earnings or higher. Take a look at the chart on this page. You can see what I'm talking about throughout history. Stocks traded over 20 times earnings in 1929... and in the late 1960s... and then in the mother of all stock market peaks in 2000.
 We have nearly 110 years of history to go on here... from Yale professor Robert Shiller. And the historical record shows you don't make money buying stocks above 20 times earnings.
In fact, when you break the numbers down, you find this... The higher above 20 times earnings you go, the less money you make over the next five years. Take a look:
.gif) The chart shows what you can expect to make in stocks five years after the P/E ratio hits 20 or higher. Specifically, it's the median annualized returns five years later.
Now, this chart is extremely conservative. I adjusted for inflation and I ignored dividend income. But even if you don't do that, the returns look terrible.
I used a different method to arrive at my numbers than Jeremy Grantham did. But the results were the same... You don't make money over the long run when you buy stocks as expensive as they are today.
While stocks are this expensive, trade carefully... with one eye on the exits. Think more about good defense than good offense.
Good defense is doing things like tightening your trailing stops, selling positions that you know are overpriced, and shrinking the size of your bets.
At these lofty prices, the outlook for stocks in general isn't good. Invest accordingly.
Good investing,
Steve
Further Reading:
Jeremy Grantham made the "Two Big Calls" better than anyone: the dot-com bust and the March '09 bottom. As of his October update, he believes "before next year is out, the market will drop painfully from current levels." ("Painfully" starts at -15%.) Get the story here: The Most Accurate Investment Forecast in History.
Market NotesEVEN HOG SHARES ARE SOARING In late 2007, we introduced a proprietary indicator called the "gold to HOG" ratio. Sounds fancy, but all we did was plot the price of gold versus the share price of motorcycle icon Harley-Davidson, symbol HOG. We introduced this ratio to track the flight of money out of expensive toys purchased on credit and into gold, which represents real, timeless wealth.
After introducing the ratio, gold soared and HOG crashed, and the ratio of "gold up, HOG down" worked out just as we thought it would. This ratio tracked our idea so well in 2007 and 2008 because consumers were buying less "landfill stuffing" on credit. Harley's profits and stock price plunged.
Now... considering we've profiled the "E-Z-Credit" boost that has lifted restaurant shares, copper, and home improvement stores, shouldn't we check in on our old friend HOG?
|
In The Daily Crux
Recent Articles
|

