
Not a subscriber? Click here to learn
more.
|
| Home | About Us | Resources | Archive | Free Reports | Market Window |
A Potential Bounce in the Japanese YenBy
Thursday, September 25, 2014
When the Prime Minister of Japan says he's going to debase the yen, it's hard to be on the opposite side of the trade...
Governments aren't good at a lot of things. But they are good at creating inflation and pummeling their currencies. And that's exactly what we're seeing in Japan today.
We've written about this idea in DailyWealth time and time again. In December 2012, Japan elected Shinzo Abe Prime Minister. His goals were clear... cut interest rates, create inflation, and boost Japan's economy.
Abe is for real. Earlier this month, the Bank of Japan bought bonds at negative interest rates. And since late 2012, just before Abe took power, the Japanese yen is down 28%.
But when the market beats down a currency this bad, we begin sniffing around for buying opportunities. And despite Abe's continued pledge to bury the yen, conditions are in place for at least a short-term bounce higher.
Let me explain...
The yen broke down a full 7% in the past two months. That's a huge move in a short period of time for a currency. And it was enough to throw sentiment on the yen to extremely negative levels.
This is most clear when we look at the Commitment of Traders (COT) report on the Japanese yen.
The COT is a weekly report that shows the real-money bets of futures traders. We use the COT as a contrarian indicator. Traders tend to be wrong when they all agree on a certain outcome... when they're all betting on the same thing.
That's exactly what we're seeing in the yen COT right now. Take a look...
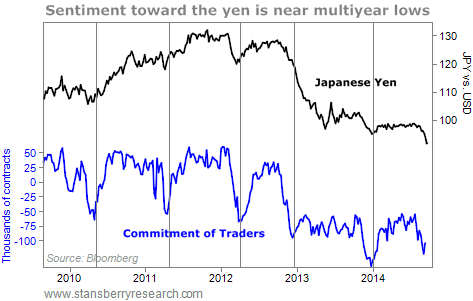 The COT bottoms at different levels, as the chart shows. But today's level is nearly as negative as what we saw at the beginning of the year. There's no question that investors expect the yen to continue its decline.
We've seen similar negative extremes in the yen five times since 2010. On average, they lead to a quick 5% gain... which is a substantial move for a currency. The table below shows the full details...
The fourth signal in the table, the one in late 2012, clearly didn't work out. However, the four other trades led to 8.4% gains in just three months, on average. History says the yen could be setting up for a bounce. If you want to buy the yen, the easiest way to make the trade is the CurrencyShares Japanese Yen Fund (FXY). This is a simple exchange-traded fund (ETF) that tracks the value of the yen versus the U.S. dollar.
Unfortunately, the trend is uniformly down. We never want to try to catch a falling knife. And that's what we have in the yen today.
This is a trade you should keep an eye on. Investors hate the yen. And when it does finally begin moving higher, history says we could see a safe gain in just a few months.
Good investing,
Brett Eversole
Further Reading:
"Extremes can occur in any market," Brian Hunt says. "By locating these extreme states – and then betting on conditions returning in the direction of normal – you can consistently make low-risk profits..." Learn more in this classic interview.
"What if there was an 'ideal wager' out there – a 'bet' with no downside risk – but all of the upside potential? It's not often that we can find an ideal wager like that," Brett writes. "But they do exist..." Get all the details here.
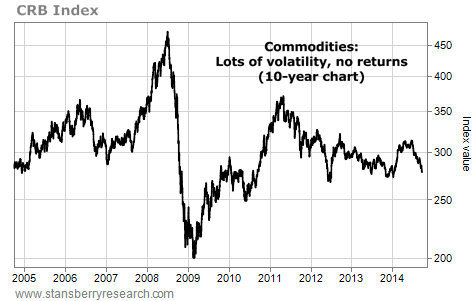
Market NotesTHE LOST DECADE CONTINUES Over the past three months, commodities have been crushed. The benchmark commodity index is down 10%.
For commodity bulls, it's a painful reminder of how tough things have been for the past 10 years.
Over the past decade, many folks have predicted a big climb in commodity prices. They say commodity prices will soar due to the debasement of the U.S. dollar. While that may happen in the future, it hasn't happened over the past decade. For proof, we consult the "CRB Index"...
The CRB is one of the most widely used gauges of commodity prices. It tracks the price of basic raw materials, like copper, oil, corn, natural gas, gold, sugar, cotton, and nickel. The recent decline in the CRB has taken this index to a level last seen in 2004.
 |
Recent Articles

|


