| Home | About Us | Resources | Archive | Free Reports | Market Window |
A Fourth Episode in ComplacencyBy
Thursday, March 16, 2006
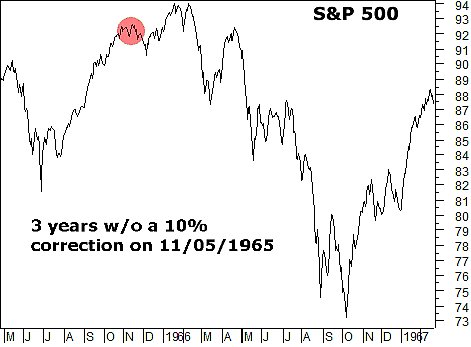
Before you read any further, I’d like you to think about your personal approach to the markets: Are you a trader, an investor or a blend of the two? If you are an investor, your path to wealth is clear: buy physical gold, tangible assets, businesses you understand, and low-volatility commodity investments. Hold them for a long time. The rest of today’s column is dedicated to the traders among us. Here’s where things get interesting. Yesterday, March 15, 2006, was a small landmark in stock market history. Not many people know about this, and even fewer people care. You might not think it’s a big deal either... until I tell you that this landmark has always marked a plunge in the S&P 500. Before I go any further, I’d like to credit Jason Goepfert of sentimentrader.com for bringing this event to my attention. I took this research – and the charts - from his daily commentary. The milestone is three years without a correction in the stock market. A correction is defined as a fall of 10% or greater in the S&P 500, marked from the highest point of the last six months. The most recent correction took the S&P from 935 to 788 between January and March 2003. This three-year period of low-volatility and rising prices is a sign of complacency in the stock market. Ten percent corrections are very common in the markets – even in bull markets – and you can expect to see one about every two years. But to go without a correction for three years...? It’s only happened three times in the last 110 years. Between 1962 and 1965, the S&P moved from 51 to 94 in a stretch of 3 years and 3 months without a correction. Over the next 9 months, the S&P fell 24%.
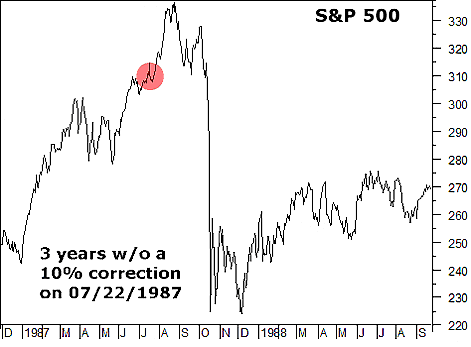
Between July 1984 and August 1987, the S&P rose from 147 to 338, a stretch of 37 months with no correction. A new Fed chairman took his seat on August 11, 1987, one of the last days of the streak. His name was Alan Greenspan. Two months later, he presided over the greatest one-day correction of all-time: Black Monday. The S&P dropped 34% that day.
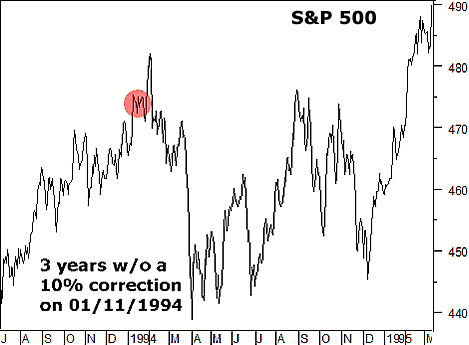
Between January 1991 and May 1994, the S&P rose from 309 to 483. This 36-month stretch was part of a bull market that followed the invasion of Kuwait in August 1990. The S&P fell 10% over the following 3 months.
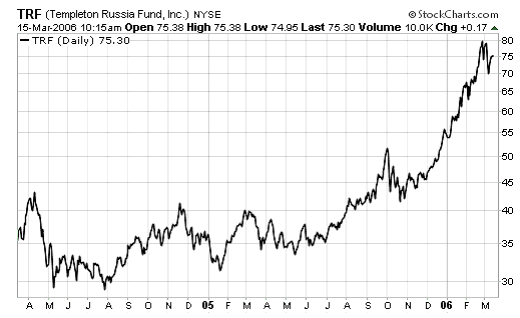
“It is the complacency... that creates the trouble,” writes Goepfert. “The longer-term studies that I've looked at recently have increasingly convinced me that investors have grown overly comfortable with the idea that ‘this time is different.’” Things are never different. If a ten-percent correction hits the S&P sometime between now and June, don’t say you haven’t been warned... Good Investing, Tom Dyson Market NotesFAT AND SASSY: THE TEMPLETON RUSSIA FUND For the past few years, we have been intrigued with placing money into Russian stocks. We felt loose monetary policy and rising commodity prices would support this commodity price-sensitive area of the stock market. Nowadays, it seems the crowd is of the same thought. Russia-specific funds like the Templeton Russia Fund (TRF) have enjoyed massive runs in the past year. Specifically, TRF has nearly doubled over the past 12 months… and now trades for a whopping 30% premium to its underlying asset value. This premium indicates a vast amount of optimism towards this area… and flashes a warning sign. In simple terms: If speculative emerging markets like Russia experience a sharp profit taking sell-off in the near future, this fund is sitting “fat and sassy”… and could suffer a fantastic drop. Nosebleed territory… the Templeton Russia Fund (two-year chart):
-Brian Hunt |
Recent Articles
|


