| Home | About Us | Resources | Archive | Free Reports | Market Window |
What I Discovered in a Newspaper from September 1930By
Tuesday, September 15, 2009
"The economy is showing unquestionable signs of life," says Labor Secretary Davis on September 12, 1930...
The stock market collapsed 48% in the Great Crash of 1929. But by 1930, it had found a bottom and started rallying again. This rally erased all the pessimism generated by the Great Crash and enticed investors back into the stock market again. By April 1930, the stock market had gained 48%. By September 1930, investors were feeling the same tentative optimism we're feeling today... This morning, I scanned a list of Wall Street Journal headlines from September 1930... "We have passed the low point of the depression," says R. Proctor, President of the New England Council, on September 13, 1930. "Over 75% of brokerage houses now recommend buying stocks," says a headline from September 14, 1930. "Brokers, businessmen and even the general public are more optimistic." Another story from the same edition reports some retailers have been "caught unawares" by an improvement in business since Labor Day. Some shoppers have had "difficulty finding goods," added the writer. In the September 12 edition, a banking industry journal reports a slight improvement in trade and industry over the previous month. The National Council of American Shipbuilders says U.S. shipbuilding has doubled in the past year. A cement manufacturer reports production up 5% in August over July levels. And a railroad sees bigger profits in 1931 as revenues increase and costs fall. Here's the thing: The stock market collapsed almost immediately after the WSJ published these optimistic headlines. Three months later, it had fallen 37%. Over the following three years, the Great Depression intensified. Unemployment jumped to 25%, thousands of banks collapsed, and world trade evaporated. By July 1923, the Dow had fallen 89% from its peak. Old timers say investors lost more money in the rebound than they did in the initial crash of 1929. We're in the same situation today. First, we had a 50% crash. Then, we got a 50% bounce. The bounce has been so strong, it's caused the country's mood to change from deep depression to cautious optimism. President Obama made a speech on Wall Street yesterday. "The storms of the past two years are beginning to break," he said. It's tempting to conclude a major collapse is coming in the stock market as we follow the path laid out by the Great Depression. But I don't think that's likely. My best guess is, we'll get a "sandpaper" market. We use the guillotine-and-sandpaper model to analyze bear markets. The guillotine is the first stage of the bear market, right after the bubble bursts. You get a quick, dramatic collapse like we had in 2008. Then you get the sandpaper stage. Stock prices fall gradually in a narrow range. The sandpaper stage frustrates both bulls and bears as prices oscillate without any clear trend. But that's just my best guess. The real conclusion of this essay is: Don't pay any attention to the newspapers, the media, or the purported "experts" when making investment decisions. These opinions have no value when it comes to forecasting the direction of the stock market or the economy. They were wrong in September 1930, and my bet is they'll be wrong again today... Instead, you should let the market tell you what to do. In DailyWealth, we often talk about watching the price of common building materials, like lumber and copper. If these materials plunge in price, it means much more than a news headline. We also like to track bonds, with shares of the big bond fund (LQD). The bond market is larger and more important than the stock market. If LQD makes meaningful new lows, it's a sign businesses can't service their debts... which would be disastrous. I lean toward believing these all-important indicators will turn lower soon... and then we'll get the sandpaper. We'll keep you updated when it comes. Good investing, Tom P.S. I found the WSJ headlines from the Great Depression on a blog called News from 1930. Each day, it publishes headlines from the Wall Street Journal for the current date 79 years ago. Reading this blog every day, you watch the Great Depression unravel in "real time." It's fascinating.
Further Reading:
Know This and You'll Never Have to Worry About the Market's Next Move Market NotesWHY THIS RALLY IS WEAK
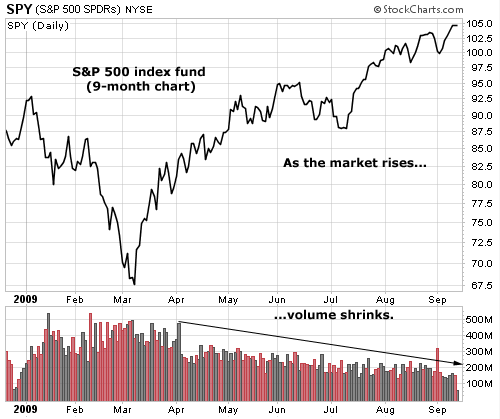
For the past several months, one of our big stock market concerns is the "case of the disappearing volume."
This case centers on the lack of "big money" buying from mutual funds, hedge funds, and insurance funds. These are the guys who control multibillion-dollar portfolios. The stock market must have their participation in order to continue rising. Our chart today shows these guys still haven't returned from summer vacation. At the bottom of the chart, you'll see a series of black and red bars. These bars represent the trading volume of the benchmark S&P 500 index fund (SPY). Red bars show the trading volume on days the market declined. Dark bars show the volume on days the SPY advanced. The taller the bar, the greater the volume. As you can see from the chart, SPY's volume tailed off drastically after its spring surge (the Dow Industrials looks the same). Buying interest is particularly weak since mid-June. Until we see buyers return with gusto, one has to take the skeptic's approach here. 
|
In The Daily Crux
Recent Articles
|

